06/03/2025, 9:03 am EDT

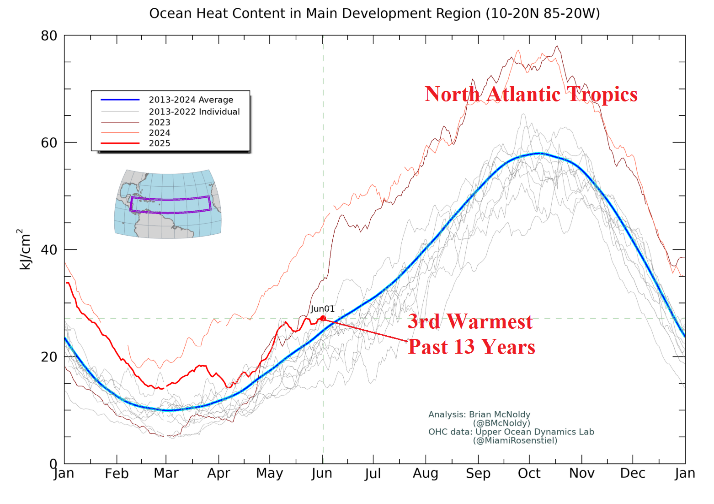
As the 2025 North Atlantic basin tropical cyclone season begins, a review of where we stand regarding upper ocean heat across various basins in the North Atlantic where tropical cyclones form and travel. In the tropical North Atlantic, upper ocean heat is above the 2013-24 normal and tied for 3rd warmest in the 13-year climatology. If warming (compared to normal) occurs during the summer months, hurricanes will be in the upper limit of 6-10 forecast by NOAA for the 2025 season.
