ECM ENS (Dynamic Model) Vs. AI 4CastNet V2 (AI Model) for U.S. in 10+ Days
04/29/2024, 5:08 am EDTThe Brazil Drought is Worsening
05/01/2024, 8:46 am EDTHighlight: The forecast remains unchanged…20 storms/10 hurricanes.
Executive summary: The Climate Impact Company North Atlantic basin seasonal tropical cyclone season forecast for 2024 is updated. Tracking the trend of ENSO and North Atlantic SSTA, the two primary predictors, is why the forecast is updated. Another forecast will be issued in late May. The predictors have changed slightly. The tropical/subtropical North Atlantic remains record warm and the lead catalyst to the very active forecast. However, the western North Atlantic basin has cooled significantly. Meanwhile, El Nino is hanging on and the trend toward La Nina has slowed. The SSTA forecast for August remains very warm across the North Atlantic tropics although La Nina is projected as less intense. The seasonal forecast remains at 20 tropical storms and 10 hurricanes while the number of intense hurricanes increases from 5 to 6. The Climate Impact Company outlook remains the most conservative of the buoyant number of storms offered by many other providers. Climate Impact Company uses the constructed analog forecast to project mid-tropospheric specific humidity (SH) for each month of the season. Given the SH values and projected steering currents, reliable projections of where hurricanes are likely to track are provided. August is hostile in the Gulf of Mexico and several threats approach the U.S. East Coast later this summer. Requests for early April seasonal forecast verification for Colorado State University outlooks are added.
Review of seasonal forecasts: The initial North Atlantic basin seasonal tropical cyclone forecasts for 2024 from Climate Impact Company, Colorado State University, and Tropical Storm Risk/U.K. are agreeable for above normal activity (Table 1). The CSU and TSR projection are remarkably similar, given the deviation from normal, while CIC is the most conservative outlook. Due to the warming oceans of recent decades and particularly within the past 5-10 years, “normal” seasonal activity is changing. Note that the conventional 30-year climatology (Table 2) is considerably lower than the 10-year and especially the 5-year optimum climate normal (OCN). The rapidly increasing number of storms each year is mostly explained by the warming North Atlantic basin as indicated by the basin-wide Atlantic multi-decadal oscillation (AMO) and tropical North Atlantic (TNA) index measured in the main development region (MDR) for hurricanes (Fig. 1). The concern in 2024 has been the projection of moderate La Nina and continued strong warm phase of the TNA index, each of which, based on climatology, support the most active tropical cyclone seasons (Fig. 2-3).
| Tropical Storms | Hurricanes | Intense Hurricanes | ACE Index | |
| CIC | 20 | 10 | 5 | 187 |
| CSU | 23 | 11 | 5 | 210 |
| TSR/UK | 23 | 11 | 5 | 217 |
Table 1: The initial seasonal forecasts of North Atlantic tropical cyclone activity for 2024 from Climate Impact Company, Colorado State University, and Tropical Storm Risk U.K.
| Tropical Storms | Hurricanes | Intense Hurricanes | ACE Index | |
| 5-Year NML | 20.6 | 8.2 | 3.6 | 139.8 |
| 10-Year NML | 16.9 | 7.6 | 3.4 | 132.8 |
| 15-Year NML | 17.7 | 7.9 | 3.5 | 132.5 |
| 20-Year NML | 16.7 | 7.7 | 3.5 | 130.8 |
| 30-Year NML | 15.5 | 7.5 | 3.4 | 130.4 |
| 50-Year NML | 13.0 | 6.6 | 2.7 | 107.0 |
Table 2: Various climatology of North Atlantic basin tropical cyclone activity.

Fig. 1: Long-term cycles of the North Atlantic basin surface temperatures identified by Atlantic multi-decadal oscillation and tropical North Atlantic index.

Fig. 2: Climatology of North Atlantic basin tropical cyclone activity based on ENSO phase and intensity.
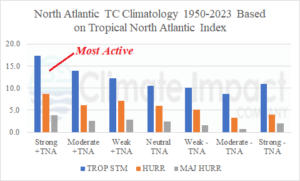
Fig. 3: Climatology of North Atlantic basin tropical cyclone activity based on tropical North Atlantic index phase and intensity.
Climate: Most important to the seasonal activity forecast is the status and forecast of El Nino southern oscillation (ENSO) and the North Atlantic SSTA pattern, particularly in the tropics and subtropics. Currently, El Nino is hanging on. The Nino34 SSTA is +0.8C which is slightly warmer than last week. Additionally, the subsurface cooling in the equatorial eastern Pacific appears to have levelled off or warmed slightly during the past 7-10 days. The slightly warmer surface SSTA near and east of the Dateline is likely related to a persistent negative southern oscillation index (-SOI) which implies the El Nino climate is lingering. Due to the slower complete dissipation of El Nino, the dynamic models indicating a weaker La Nina for later this year are preferred.
In the North Atlantic basin, the western basin including the Gulf of Mexico and more recently the Caribbean Sea have cooled (Fig. 4). The western North Atlantic and Gulf of Mexico are essentially near normal. However, in the tropics and subtropics of the outer North Atlantic basin a robust record-warm signature remains.
The ECMWF global SSTA forecasts are closest at initialization and the projection for August (Fig. 5). A weak La Nina is indicated in August with previously anticipated robust warming of the North Atlantic basin. Also indicated, and possibly a contributor to the weaker La Nina signal, is presence of positive phase Indian ocean dipole (+IOD). The presence of +IOD slightly inhibits the usual heavy convection in the tropical West Pacific during La Nina which causes a weaker La Nina signal farther downstream east of the Dateline.

Fig. 4: Current global SSTA analysis reveals lingering El Nino, a cooling western North Atlantic basin, and record warm tropical North Atlantic.
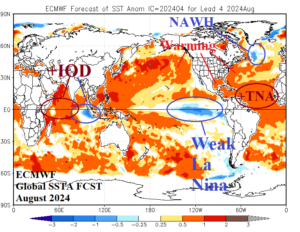
Fig. 5: The ECMWF global SSTA forecast for August 2024 indicates a weak El Nino possibly caused by emergence of positive phase Indian Ocean dipole while the North Atlantic tropical warmth spreads northward.
The updated seasonal forecast: The updated seasonal activity forecast is based on an analog considering the ENSO and North Atlantic SSTA current and projected conditions discussed above plus the 5-year OCN which identifies the recent over-achieving character of seasonal activity due to persistent and stronger North Atlantic warming. The updated forecast is similar with a previous outlook indicating 20 tropical storms, 10 hurricanes, and a change from 5 to 6 intense hurricanes. The accumulated cyclone energy (ACE) index is 179 down slightly from 187. The analog years featured buoyant seasonal activity although held back slightly in 2016 by a Caribbean Sea tropical upper troposphere trough (TUTT).
| Year (weight) | Tropical Storms | Hurricanes | Intense Hurricanes | ACE Index |
| 2017 (3) | 17 | 10 | 6 | 225 |
| 2016 (2) | 15 | 7 | 4 | 141 |
| 2005 (2) | 28 | 15 | 7 | 245 |
| 5-Year OCN | 20.6 | 8.2 | 3.6 | 139.8 |
| Average | 20.0 | 10.0 | 5.9 | 178.8 |
| Forecast | 20 | 10 | 6 | 179 |
| Previous | 20 | 10 | 5 | 187 |
| 5-Year NML | 20.6 | 8.2 | 3.6 | 139.8 |
| 15-Year NML | 16.9 | 7.6 | 3.4 | 132.8 |
| 30-Year NML | 15.5 | 7.5 | 3.4 | 130.4 |
Table 3: The CIC-CA North Atlantic basin 2024 seasonal tropical cyclone activity forecast.
Forecasting where hurricanes will track: To project where the most likely track of where stronger storms (hurricanes) have the most (monthly) impact, the analog years are averaged to present where high specific humidity (SH) at 600 MB is located which identifies where mid-tropospheric moisture is highest and supportive of tropical cyclone activity. The anomalous SH regions are compared with climatology to estimate hurricane tracks.
June 2024: The CIC-CA forecast indicates above normal SH in the Gulf of Mexico. Based on climatology, June tropical cyclone risk is present mostly in the Gulf of Mexico. The projected upper air pattern indicates westerly steering across the northern Gulf well south of a Northeast U.S. upper trough. The upper shear provided by the steering current should prevent a hurricane. However, an east to northeast moving tropical storm, born in the Gulf, tracks across the Florida Peninsula and out to sea toward Bermuda.
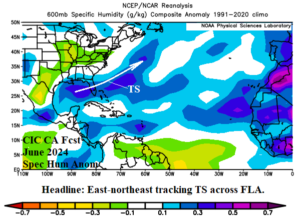
Fig. 6: The CIC-CA projection of potential tropical cyclone tracks in June 2024.
July 2024: Favored areas for development during July based on climatology are the northern Gulf of Mexico and off the U.S. East Coast where waters are warming. The Caribbean Sea is generally marginally supportive of tropical cyclone activity in July while the outer tropics are typically dormant. In 2024, coupling the SH analog and projected upper air, there is support for tropical storms into Louisiana and off the Carolina Coast. Upper shear prevents hurricane development. However, if the Gulf warms faster than projected, the Louisiana storm could be a hurricane. Additionally, based on the SH forecast off the West Africa Coast, an early season tropical storm is possible in the outer Atlantic.

Fig. 7: The CIC-CA projection of potential tropical cyclone tracks in July 2024.
August 2024: Buoyant SH is indicated by the CIC-CA forecast in the Gulf of Mexico and much of the North Atlantic subtropics. The projected upper air pattern indicates the “Bermuda High” is lodged off the North Carolina Coast. An upper trough is across the Upper Midwest States. Steering currents are settled east-to-west across the Caribbean Islands and into the Gulf then sweeping northward guided by the Upper Midwest trough. At least two hurricanes are forecast into the northern Gulf of Mexico region. On the immediate back side of the “Bermuda High” a hurricane is forecast to track into the coastal Carolinas. Another hurricane is projected out to sea. A dangerous month with at least 4 hurricanes.

Fig. 8: The CIC-CA projection of potential tropical cyclone tracks in August 2024.
September 2024: The most active part of the North Atlantic basin for tropical cyclones during September is from near Puerto Rico to the Bahamas and just off the Atlantic Seaboard based on the CIC-CA SH forecast coupled with the projected upper air pattern a similar scenario is forecast. Expect at least two powerful hurricanes to just miss the East Coast during September with a 3rd hurricane out to sea. The Gulf of Mexico receives a reprieve after a hostile August.
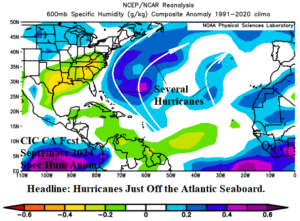
Fig. 9: The CIC-CA projection of potential tropical cyclone tracks in September 2024.
October 2024: Indications are very supportive of at least one hurricane in the Caribbean Sea likely drifting northward during October. The upper air pattern features a strong high-pressure area over New England. The steering currents could potentially take a Caribbean system farther west and into the Gulf of Mexico.

Fig. 10: The CIC-CA projection of potential tropical cyclone tracks in October 2024.
November 2024: Given the anomalous warm waters of the tropical North Atlantic likely to last into late year, a Caribbean hurricane in November is expected.
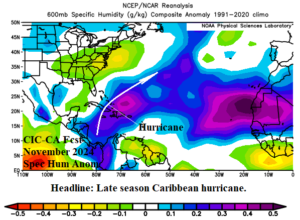
Fig. 11: The CIC-CA projection of potential tropical cyclone tracks in November 2024.
The specific humidity anomaly for the 2024 season based on the CIC-CA forecast is extremely buoyant in the subtropics, more so than the 2005 season which was strongest on record. As previously stated, the forecast tracks indicated for each month could easily be repeated and if so, the projection of 10 hurricanes could be exceeded.
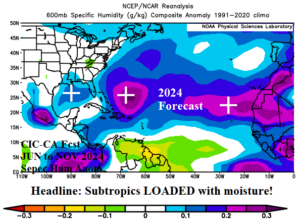
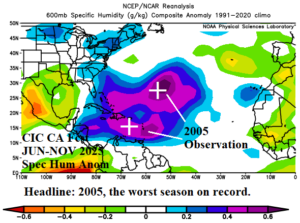
Fig. 12-13: Comparing the JUN-NOV 2024 specific humidity anomaly forecast with the most active year on record in 2005.
Early April CSU seasonal forecast verification: Requests were made to identify the forecast verification of early April forecasts by Colorado State University of seasonal tropical cyclone activity across the North Atlantic basin. The average error of numbers of tropical storm forecasts (Fig. 14) is 4.5 with a bias of +2.7 (more occurring than forecast). The forecast error for the number of hurricanes (Fig. 15) is 2.9 with a bias of +0.8. The forecast error for the number of intense hurricanes (Fig. 16) is 1.7 with a bias of +0.5. Clearly indicated is the bias toward more events than forecast largely due to the warming North Atlantic and occasional incorrect ENSO phase.

Fig. 14: Colorado State University early April tropical storm forecasts and verification.
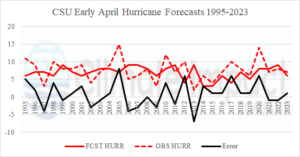
Fig. 15: Colorado State University early April hurricane forecasts and verification.

Fig. 16: Colorado State University early April intense hurricane forecasts and verification.