
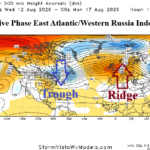
Strong Positive Phase Eastern Atlantic/Western Russia (EAWR) Index Dominates North America/Europe Medium-range Outlook
08/07/2026, 7:01 am EDT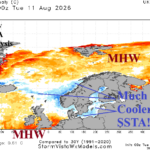
Cooling SSTA Surrounding Northern Europe Foreshadows Incoming Cool Trough
08/12/2026, 5:25 am EDT
Climate Impact Company Early U.S. Report
Issued: Monday August 10, 2026
Highlight: Wet monsoon eases Southwest U.S. extreme heat and enhances this week’s severe weather arc through the Midwest U.S.; Big Mid-south heatwave!
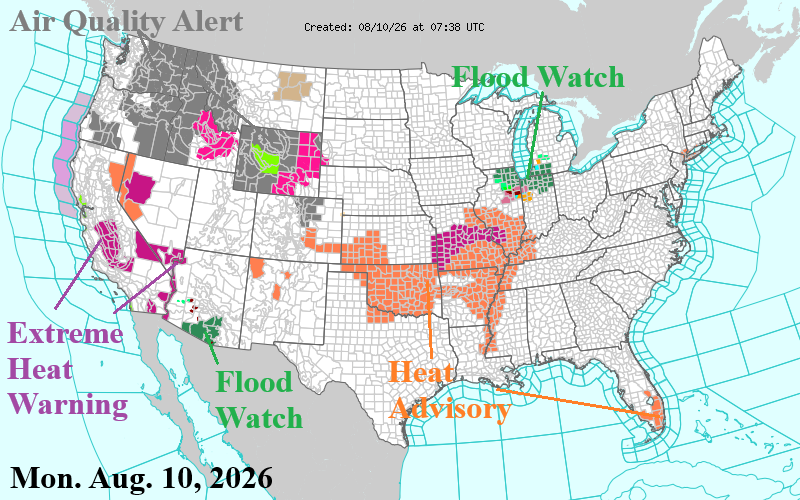
Fig. 1: NOAA/NWS weather watch, warning, and advisory areas.
Discussion: The extreme heat in the Southwest U.S. is abating as the (wet) monsoon begins to organize. Excessive Heat Warning’s remain in parts of California and the Great Basin and are replaced by Flood Watch areas in Arizona (Fig. 1). The NBM 7-day rainfall forecast identifies the arc of Mexico to Arizona thunderstorms northeastward to Colorado and possibly adding Nevada and California (Fig. 2). The Northwest U.S. Air Quality Alerts are ongoing. A strong eastward plume of smoke and dust is forecast for midweek, possibly extending across the entire Northern U.S. In 5 days, CAMS (model) indicates the high intensity smoke/dust shifts farther south in Washington State (Fig. 3). Heat Advisories are expanding in the Mid-south States as a long duration heatwave is forming. The SPP 15-day population weight daily average temperature forecast projects consistent ABOVE too MUCH ABOVE normal heat intensity (Fig. 4). North of the heat dome, ring of fire severe thunderstorms, heavy rain, and flooding persists in the 7-day forecast stretching from the North-central U.S. into the Mid-Atlantic region (Fig. 5). The Ohio Valley is hardest hit by the heavy rain and damaging wind gust weather pattern. The East shifts cooler in the medium range although the Mid-south U.S. heatwave intensity is dramatic and forces hotter CDD forecasts for the next 2 weeks after the hottest week (Aug. 6-12) of summer (Fig. 6).
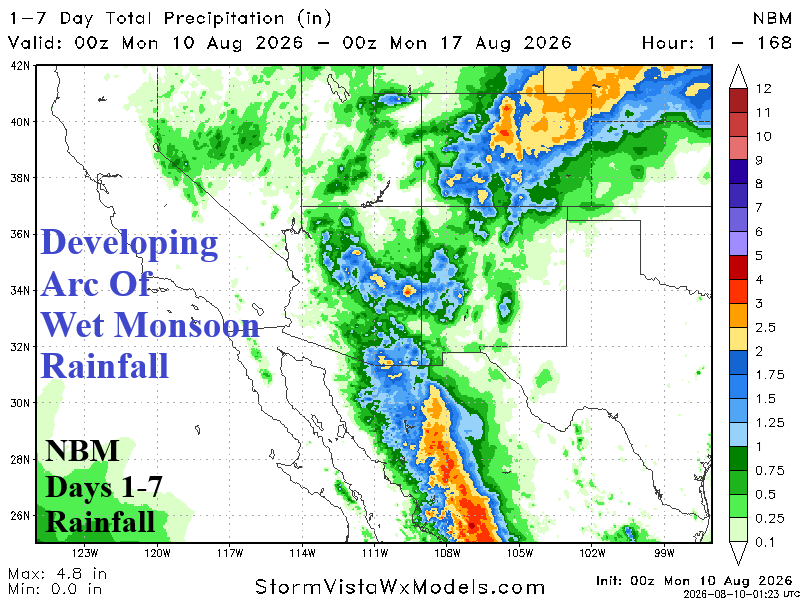
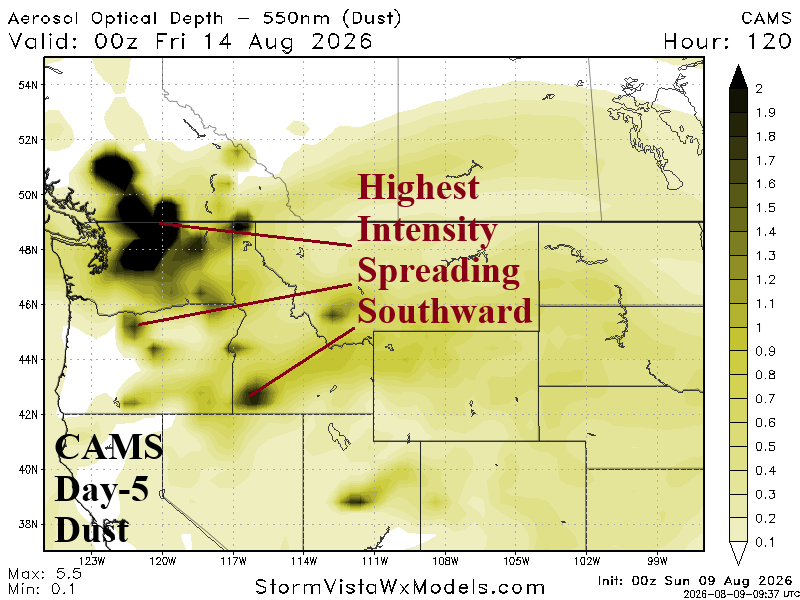
Fig. 2-3: NOAA/WPC 7-day U.S. quantitative precipitation forecast.
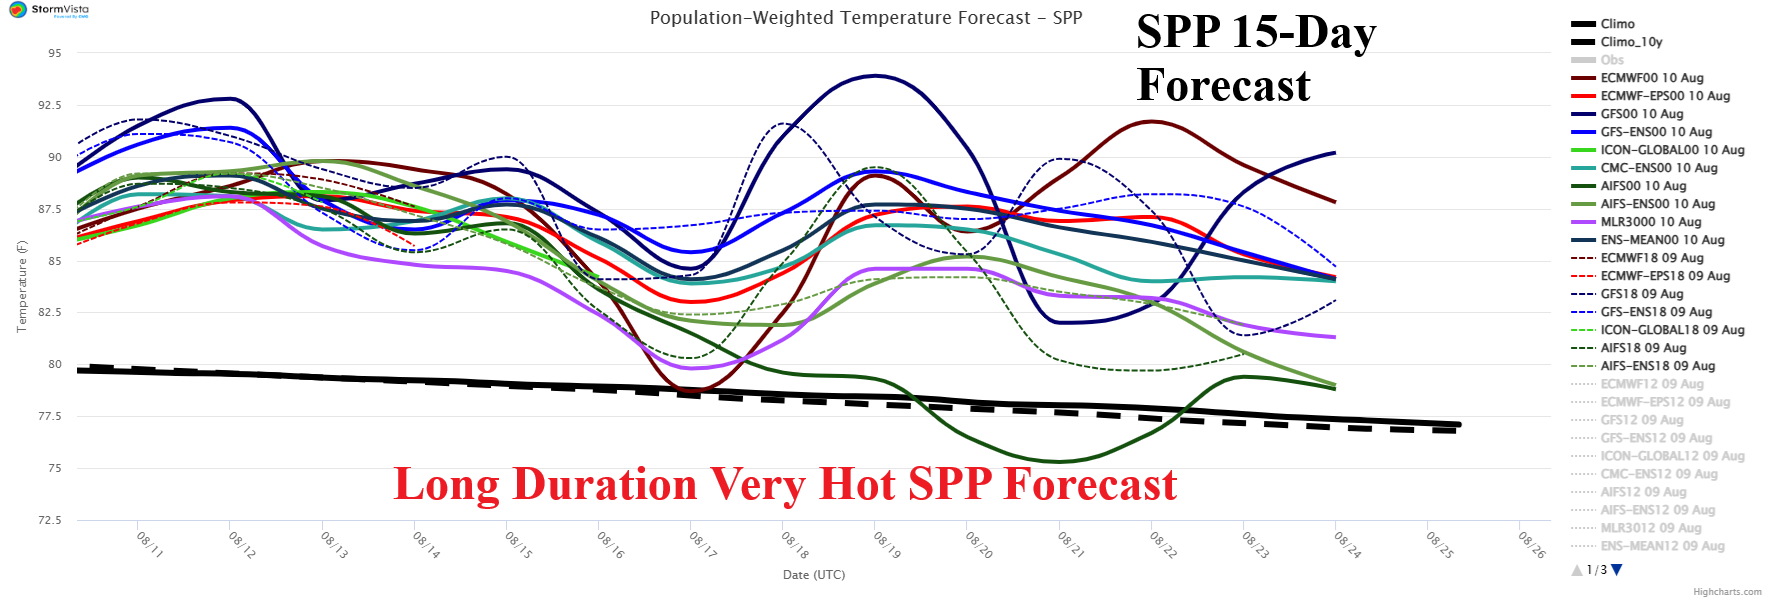
Fig. 4: Utilizing all models, the 15-day population weight daily average temperature forecast across the SPP region.
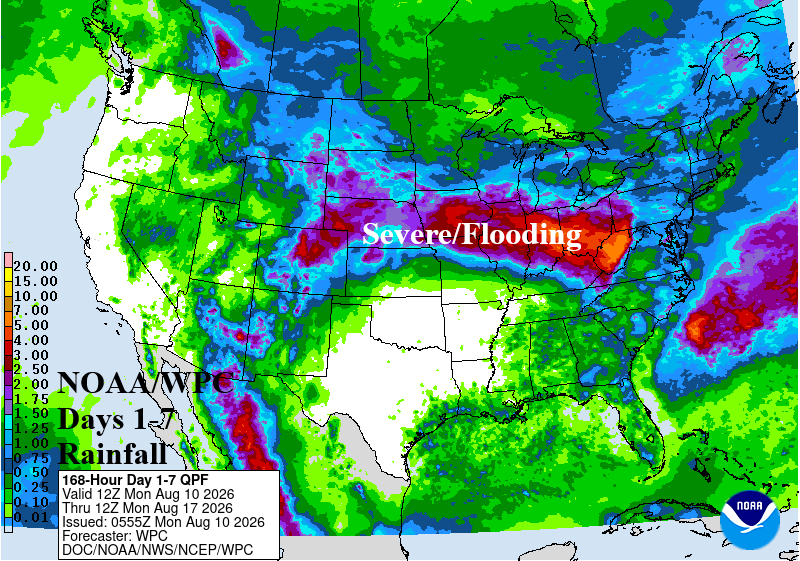
Fig. 5: NOAA/WPC 7-day quantitative precipitation forecast.
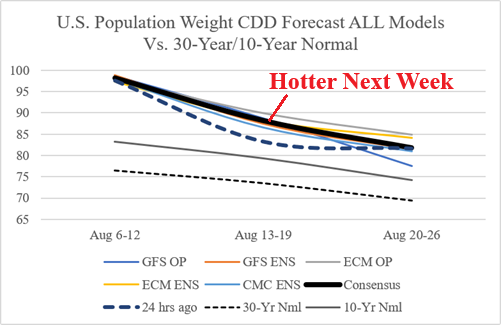
Fig. 6: The U.S. population weight CDD forecast utilizing all operational models, their consensus, and comparing with 24 hours ago plus the 30-year/10-year normal.