
Southern U.S. Drought Erasure; Mild Winter Outlooks Using New NOAA Long-lead Probabilistic Climate Outlooks
10/15/2026, 10:13 am EDT
Climate Impact Company Early U.S. Report
Issued: Monday October 19, 2026
Highlight: Expanding snow cover, emerging cold bias, and the season’s first arctic air mass. But, tropical/subtropical forcing maintain warm U.S. bias.
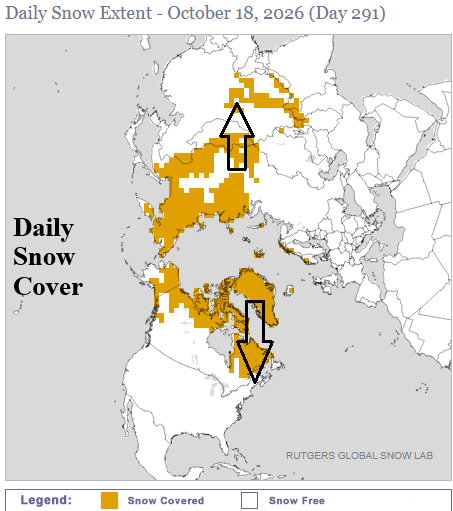
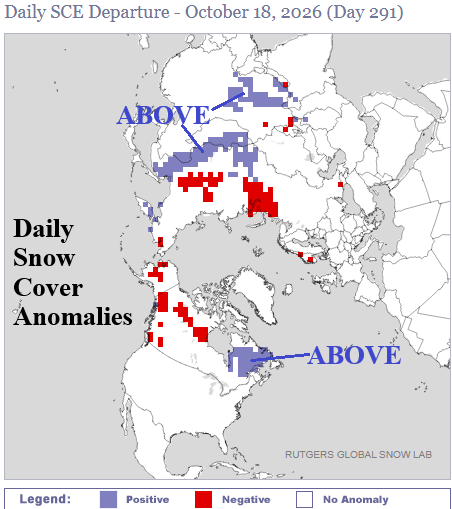
Fig. 1-2: Daily northern hemisphere snow cover and snow cover anomalies analysis from Rutgers University Snow Laboratory.
Discussion: Snow cover is advancing, providing cold bias, and allowing arctic air to gather during the last third of October. Snow cover advance is notable in Quebec and Northeast/Interior East Asia (Fig. 1). Above normal snow cover in these regions has increased significantly during recent days (Fig. 2). In North America, the Quebec snow cover can provide “sneaky” cool-to-cold days for Quebec (Fig. 3) extending south (at times) into NEPOOL (Fig. 4) as observed this morning. Across the northeastern Eurasia snow cover, the season’s first widespread arctic air mass evolves in the 8-14-day period (Fig. 5) inspired by some marginal stratospheric warming (Fig. 6). In the U.S., the primary climate forcing is lingering late season tropical/subtropical influences such as East Pacific tropical cyclones and attempts at subtropical storm development off the U.S. East Coast (Fig. 7). In between the wet regimes the Interior East is dry. The tropical/subtropical forcing biases U.S. climate warmer than normal although U.S. gas population weight HDD are slightly cooler than 24 hours ago (Fig. 8).
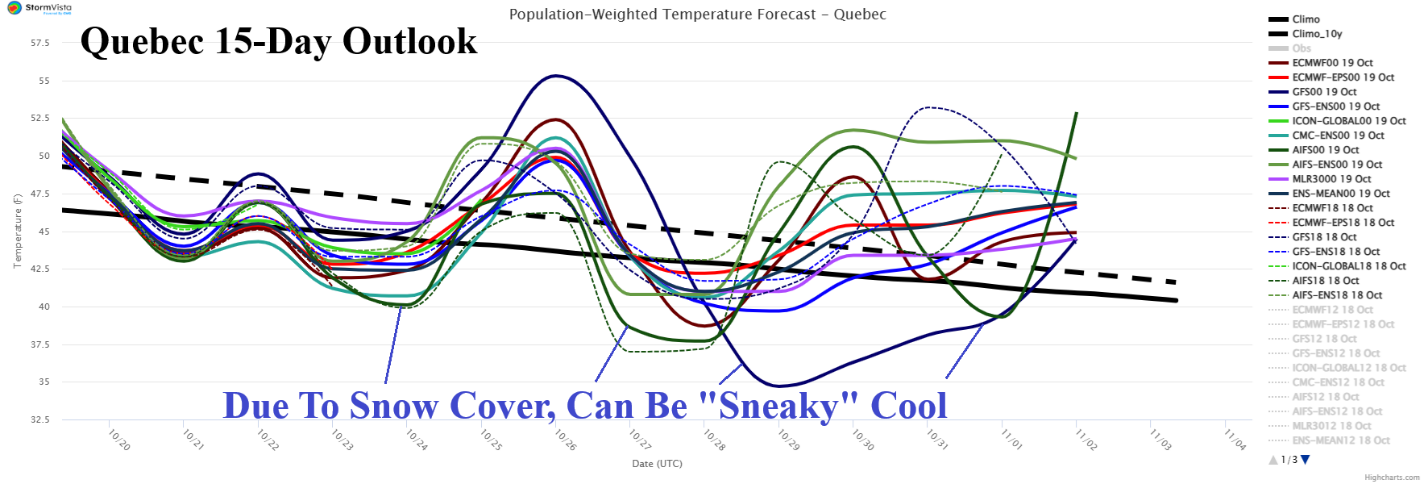
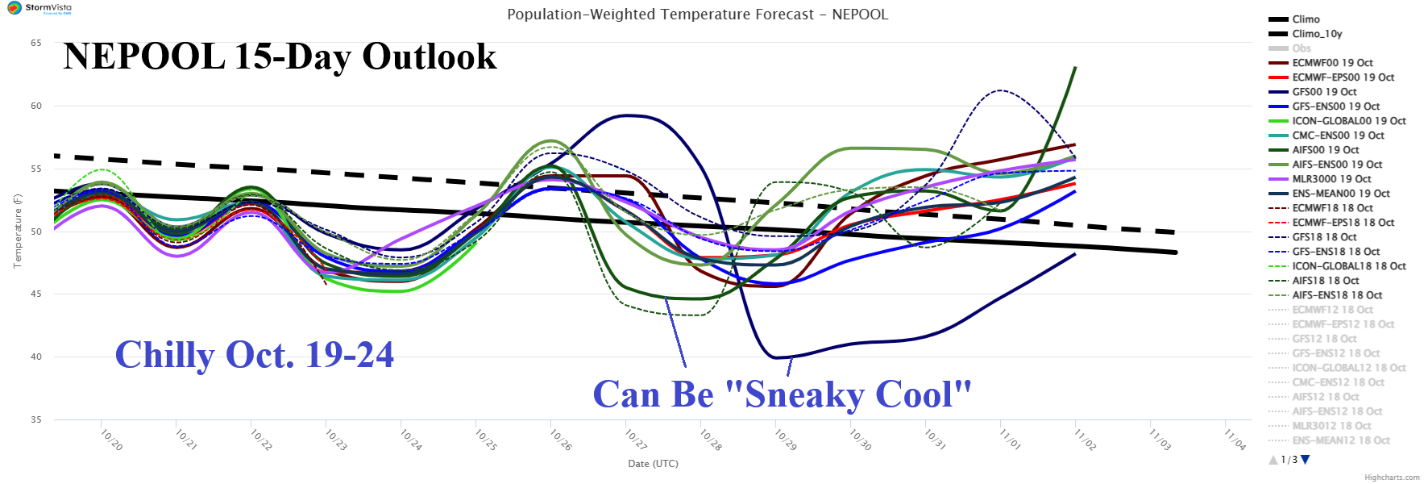
Fig. 3-4: The 15-day population weight daily average temperature forecast for Quebec and NEPOOL identifying “sneaky” cold bias supported by nearby snow cover.
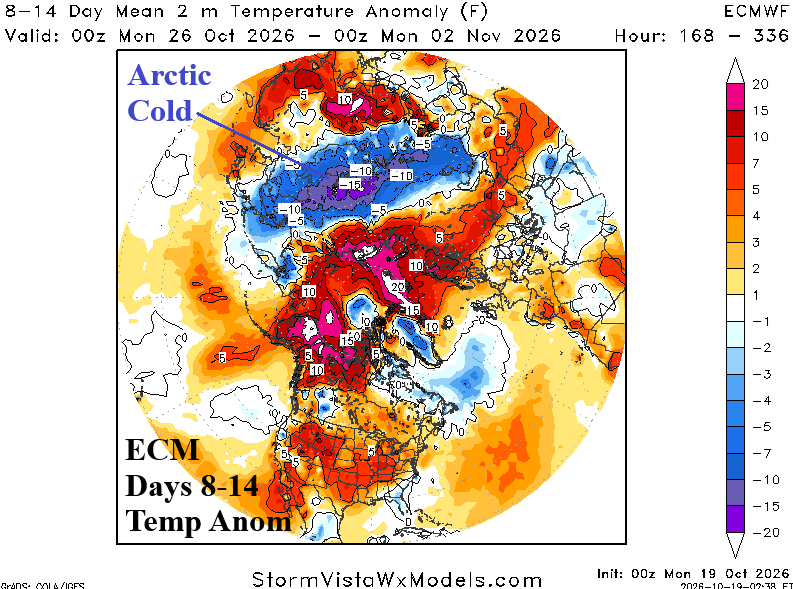
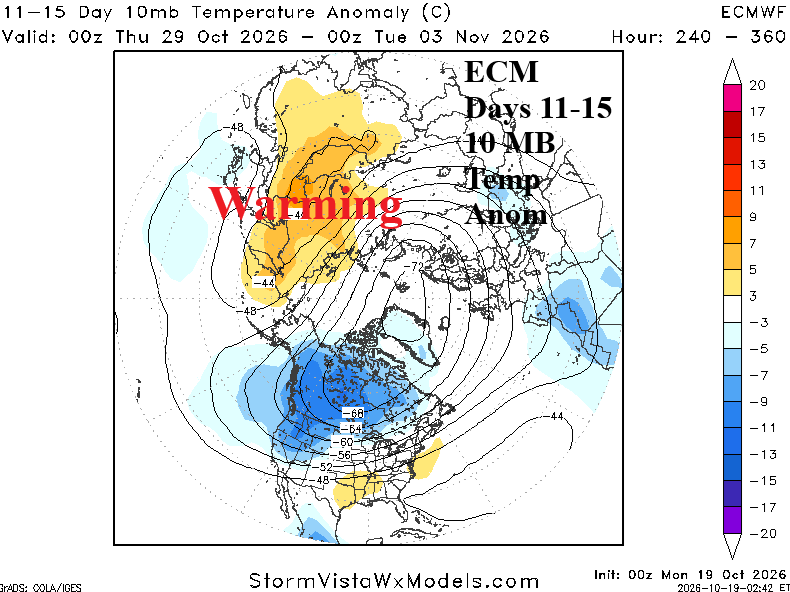
Fig. 5-6: Arctic air gathers across Eurasia in the 8-14-day period beneath marginal to moderate stratospheric warming.
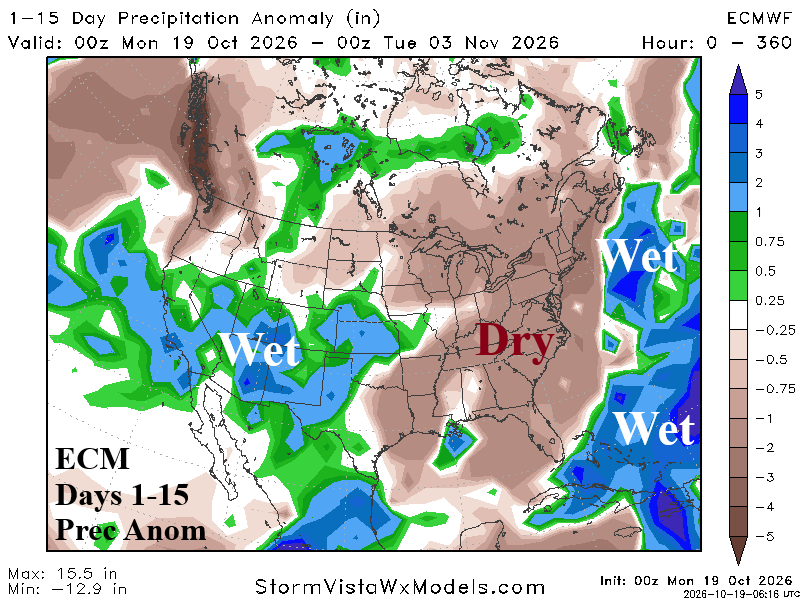
Fig. 7: The 15-day U.S. precipitation anomaly forecast by ECM.
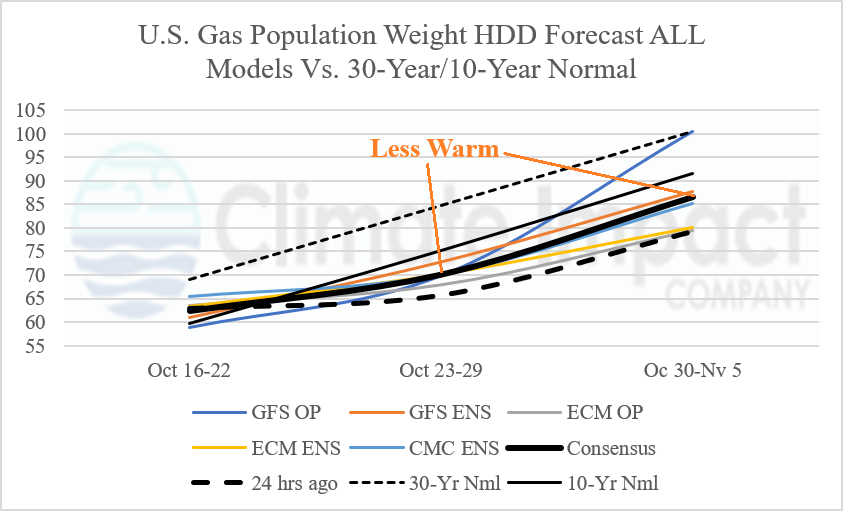
Fig. 8: Collection of operational models and their U.S. population weight HDD forecasts through early November.