
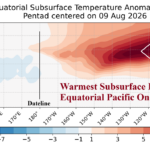
Super El Nino Propelled by Extremely Warm Subsurface Ocean Temperatures
08/17/2026, 2:10 pm EDT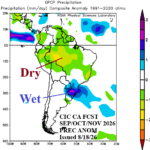
Evolving Central/North Brazil Drought/Flood Rain Southeast Brazil ALERT for SEP-DEC 2026
08/19/2026, 4:31 am EDT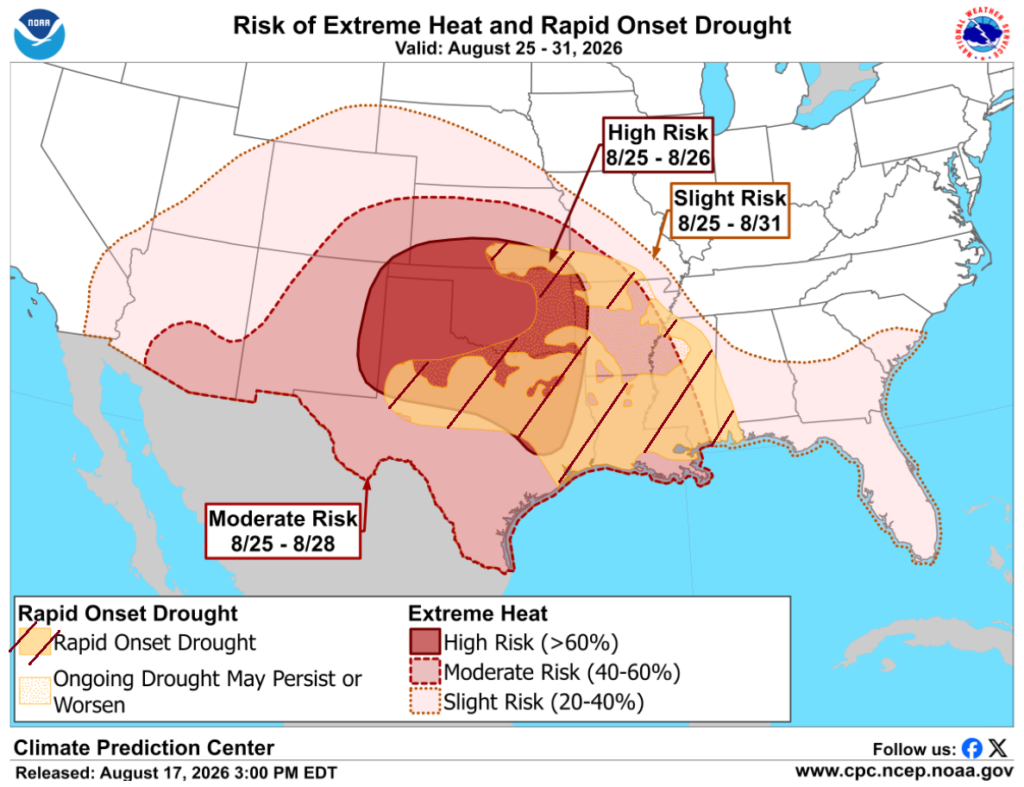

Climate Impact Company Early U.S. Report
Issued: Tuesday August 18, 2026
Highlight: The new drought; SPP/ERCOT heat.
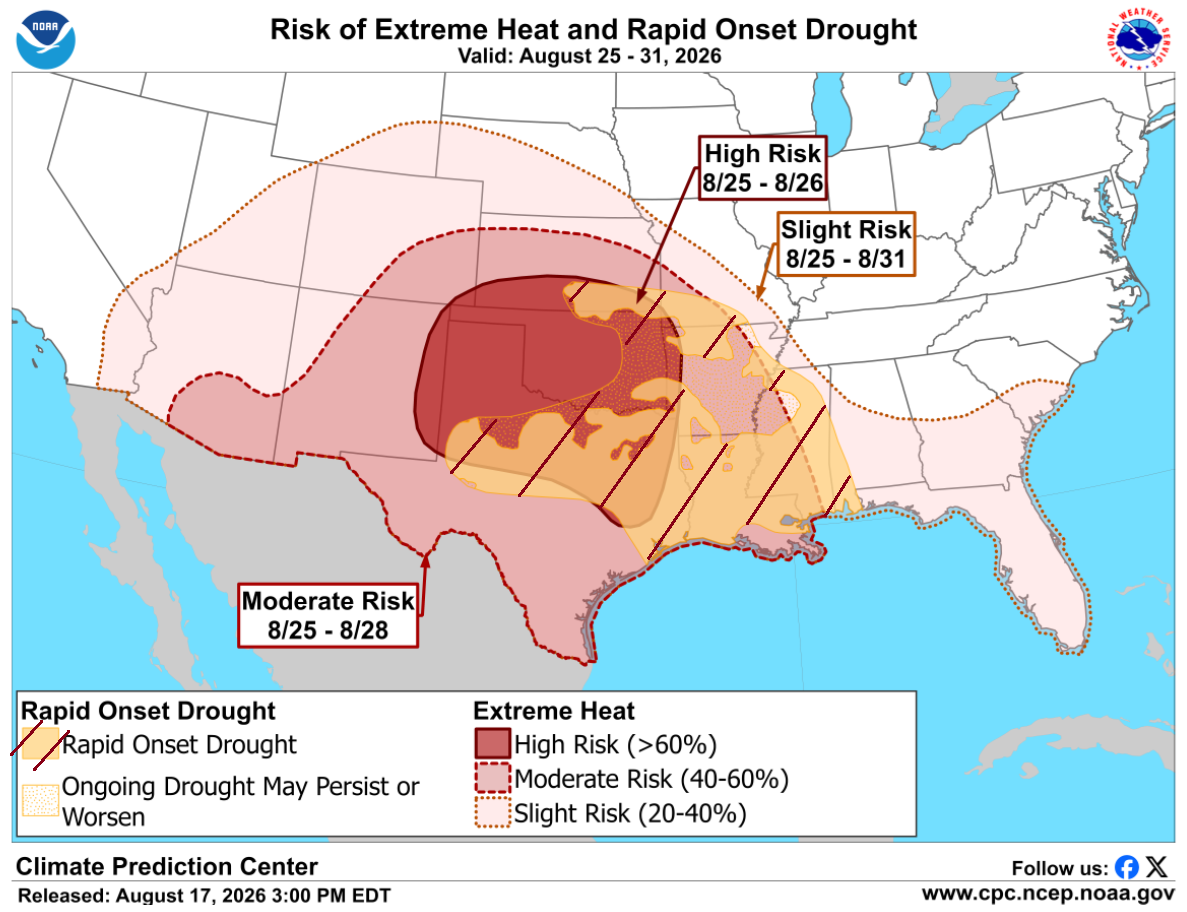
Fig. 1: NOAA/CPC issues an alert for rapidly developing drought across the Mid-south U.S.
Discussion: NOAA/CPC issues an alert for the medium range for extreme heat risk covering the southern half of the Great Plains and much of the Southern U.S. (Fig. 1). The attendant lack of rain is causal to flash drought affecting eastern and northern Texas, all of Oklahoma, southeastern Kansas, western Arkansas, and most of Louisiana and Mississippi.
A flash drought due to late summer anomalous heat and lack of rainfall is common in this region during the onset of El Nino as observed using a consensus of 1997, 2015, and 2023 El Nino onset analog years (Fig. 2-3). The 2026 version is larger likely related to unusually anomalous warm oceans off the West Coast of Mexico and the subtropical North Atlantic. During AUG/SEP during the analog years, low pressure typically hovers near the Northwest and Northeast States with the cresting high-pressure zone causing the flash drought in between (Fig. 4).
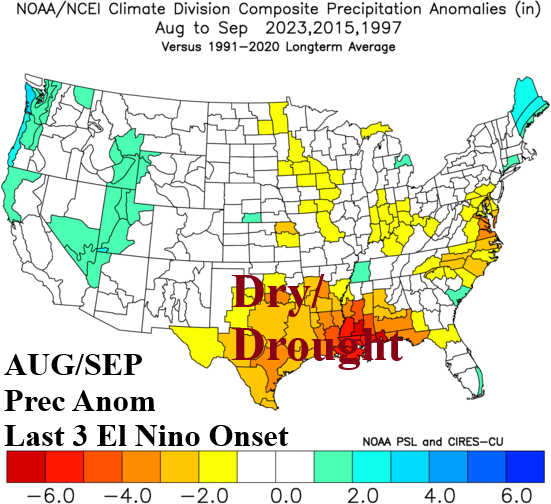
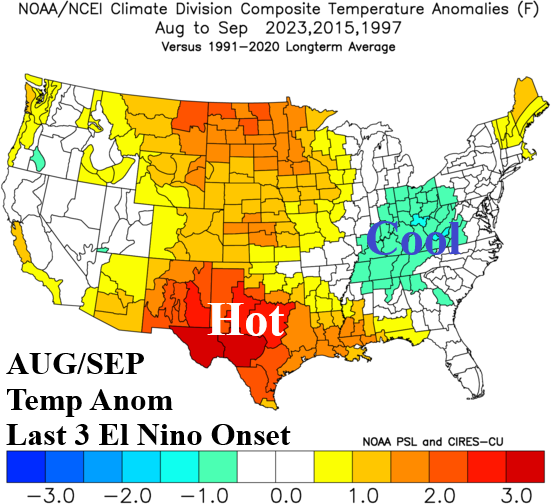
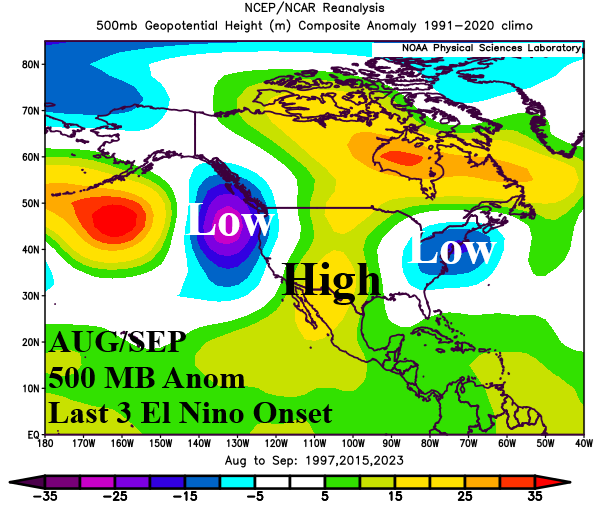
Fig. 2-4: Onset of El Nino typically brings dry-to-drought and anomalous heat conditions during AUG/SEP to Texas and vicinity.
Of course, ERCOT is hardest hit by the heatwave with steady anomalous heat each day in the latest 15-day outlook (Fig. 5) easily the hottest and longest duration heat of summer 2026. Southern SPP is also hit hard with steady anomalous heat for much of the next 2 weeks (Fig. 6). The U.S. population weight CDD remains warmer than normal into early September with a slightly warmer adjustment for next week (Fig. 7).
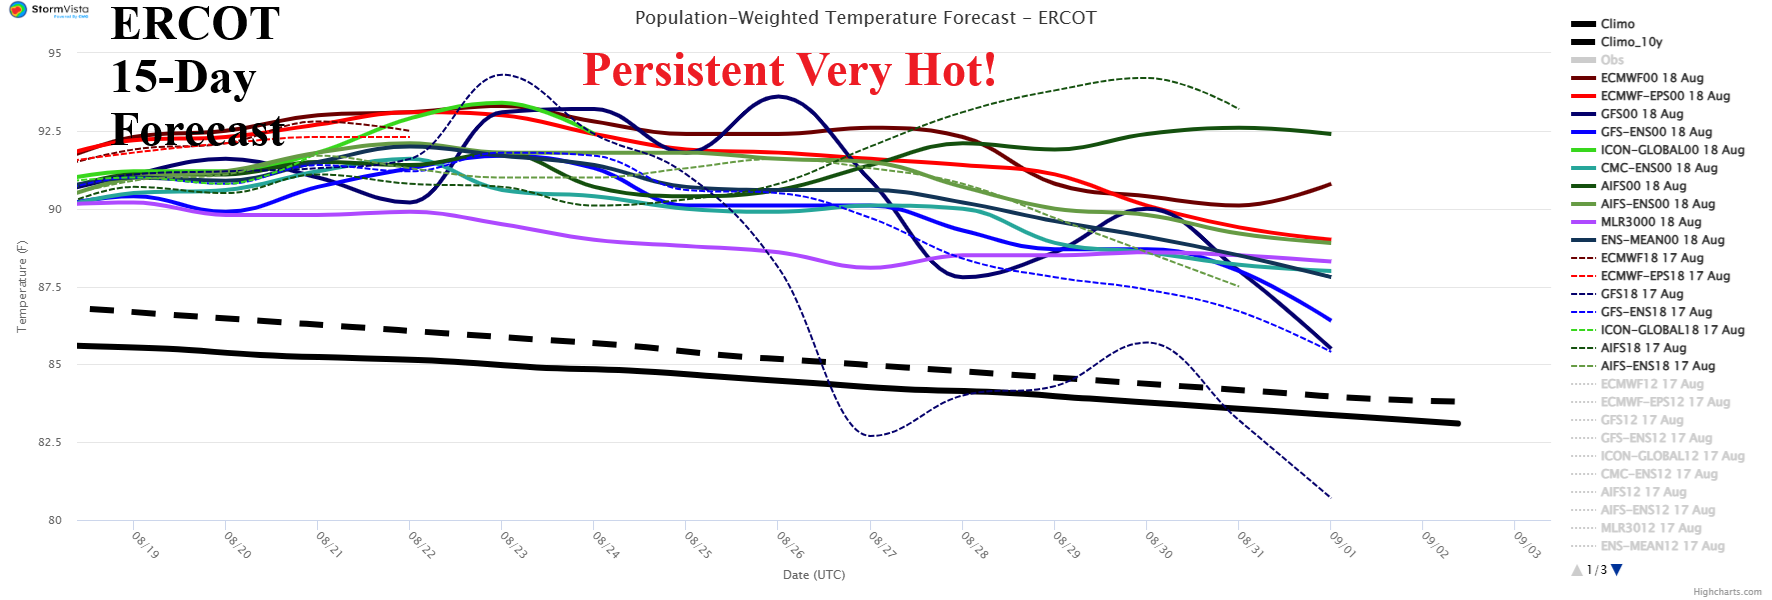
Fig. 5: Utilizing all models, the 15-day average daily temperature forecast for the ERCOT region.
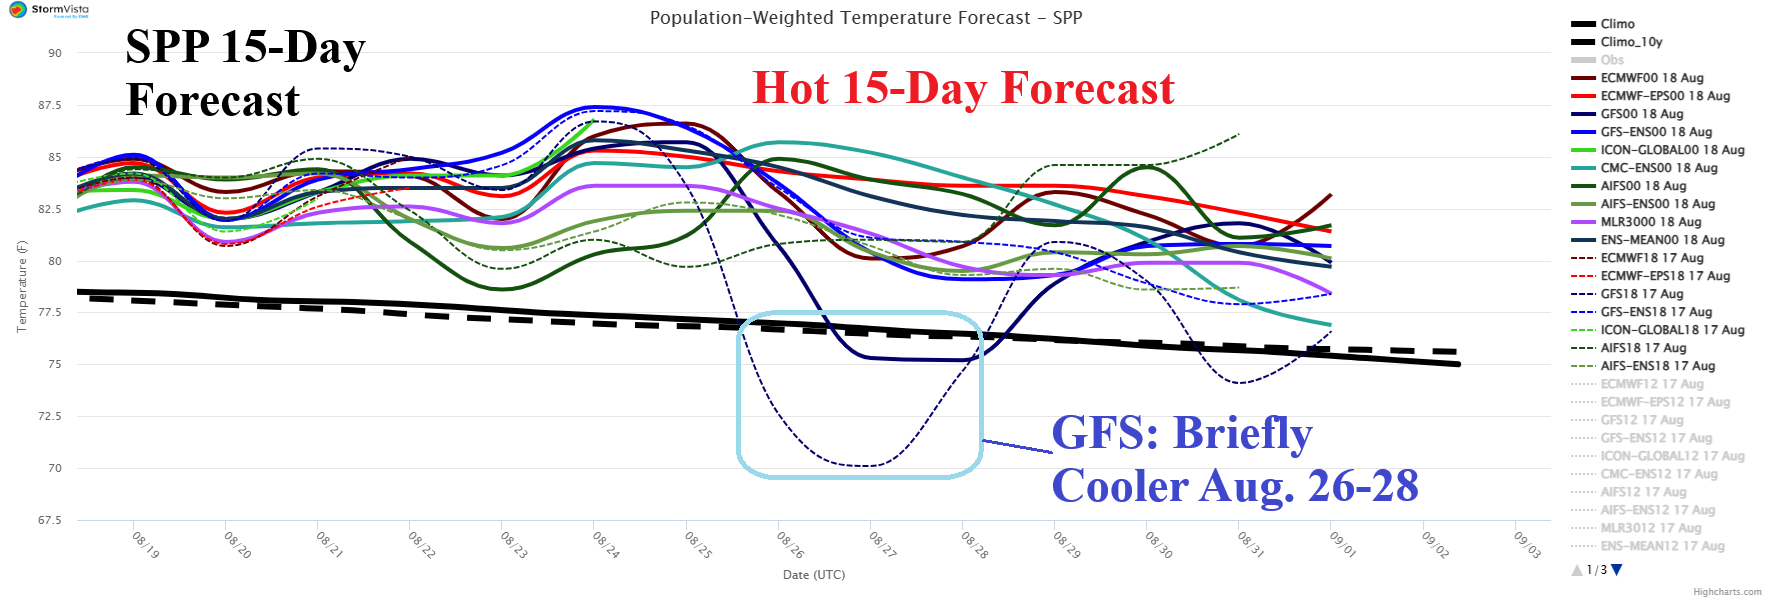
Fig. 6: Utilizing all models, the 15-day average daily temperature forecast for the SPP region.
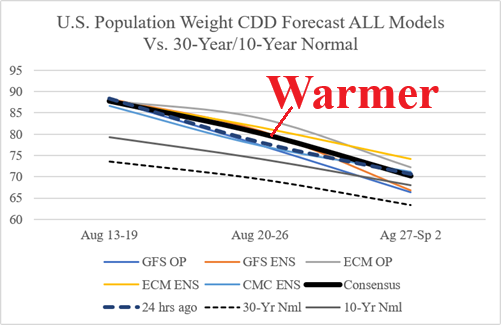
Fig. 7: U.S. population weight CDD forecast utilizing all models, their consensus, and comparing with 24 hours ago and 10-year/30-year climatology.