
Does The Week 2-4 Outlook in the U.S. Follow El Nino Late Summer Climatology?
07/17/2026, 1:47 pm EDT
Heavy Rain Southeast Brazil Ahead!
07/20/2026, 5:47 am EDT

Climate Impact Company U.S. Sunday Report
Issued: Sunday, July 19, 2026
Highlight: Hotter, but not East. Wet Southwest, Gulf States, and East Coast. Second tropical storm ahead this week, turns westward on Gulf Coast.
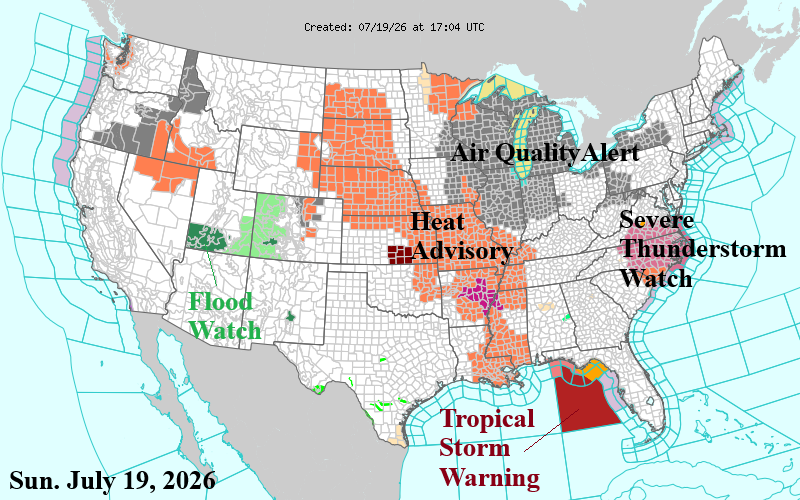
Fig. 1: NOAA/NWS weather watch, warning, and advisory areas.
Discussion: Air Quality Alert is posted for the Midwest only as the Northeast Corridor has cleared (Fig. 1). The Midwest smoke/dust plume edges eastward and into the Northeast while weakening the next 2-3 days with another plume into the Midwest just after midweek. Heat Advisories stretch through much of the Central U.S. to Louisiana this afternoon. A Severe Thunderstorm Watch is issued for Virginia and the eastern Carolinas. The wet monsoon sponsors a Flood Watch in Southwest Utah.
A new development is organization of thunderstorm activity in the northeast Gulf States where Tropical Depression 2 has formed. This system gains a name (Bertha) tonight and the most likely track is northwestward to the central Gulf of America Coast and then westward near the coast (Fig. 2). Forecasts are preliminary. Tropical cyclone models are in favor of a west-northwest track with strengthening to tropical storm (Fig. 3-4). No models indicate hurricane potential for now. Proximity to land, once organized, defeats significant intensification. However, SSTs are warmer than normal in the 29-30C range which could allow over-achieving intensity if sufficient duration away from the land mass.
Madden Julian oscillation (MJO) is in a favorable location to produce abundant convective rains in the U.S. The NOAA/WPC 5-day quantitative precipitation forecast identifies the excessive rainfall associated with T.D. 2 in the Northeast Gulf, East Coast heavy rains, and a wet Southwest U.S. monsoon pattern (Fig. 5).
The U.S. population weight CDD projection through early August has shifted considerably warmer since Friday primarily due to a hotter Central U.S. forecast (Fig. 6). The week 3-5 U.S. CDD forecast maintains hot ECM projections while AI is cooler (Fig. 7).
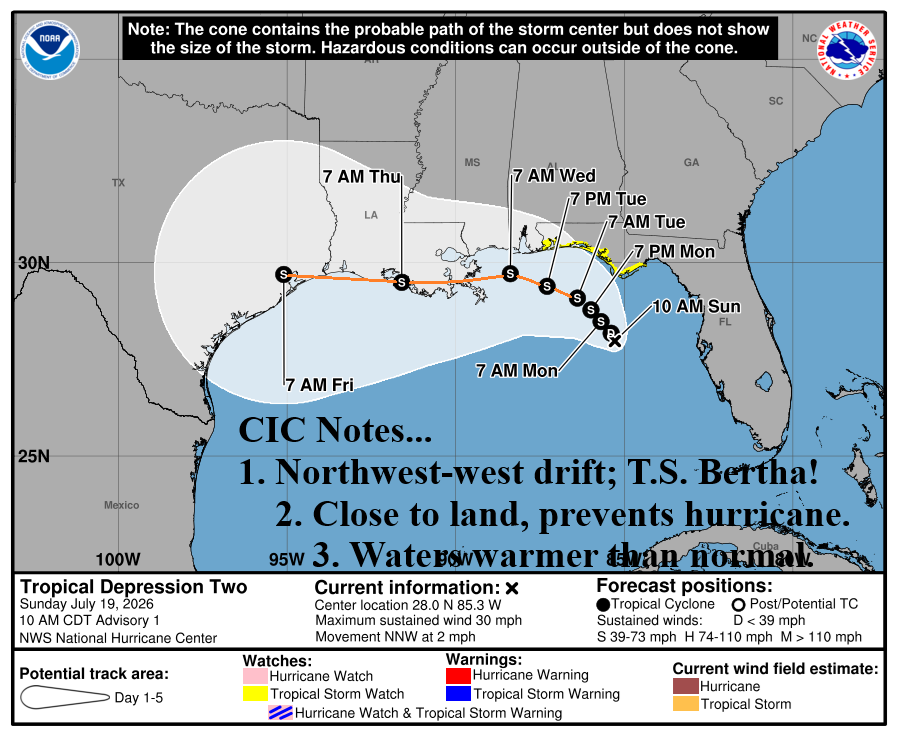
Fig. 2: NOAA/NHC 5-day forecast track for T.D. 2.
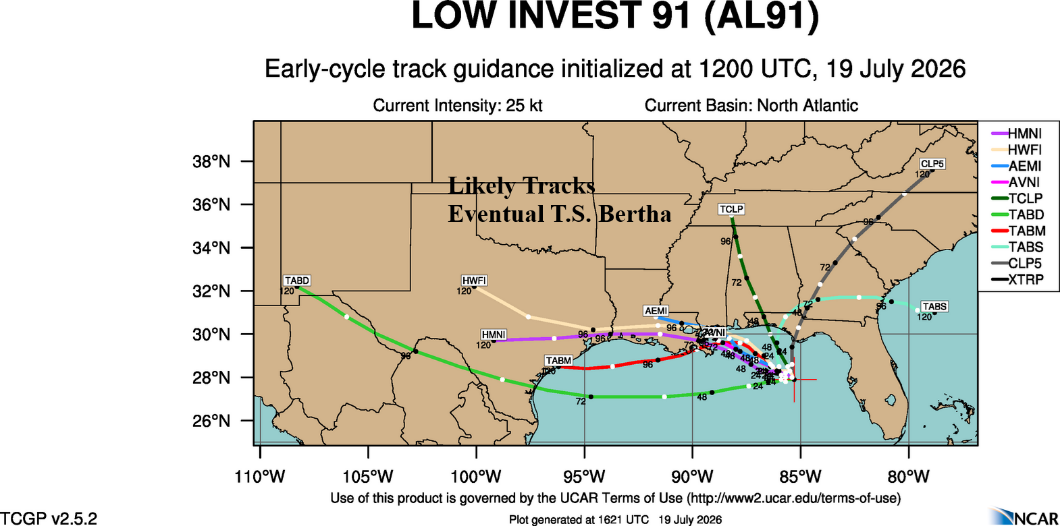
Fig. 3: Tropical cyclone model tracks and their 5-day projection for TD 2/TS Bertha.
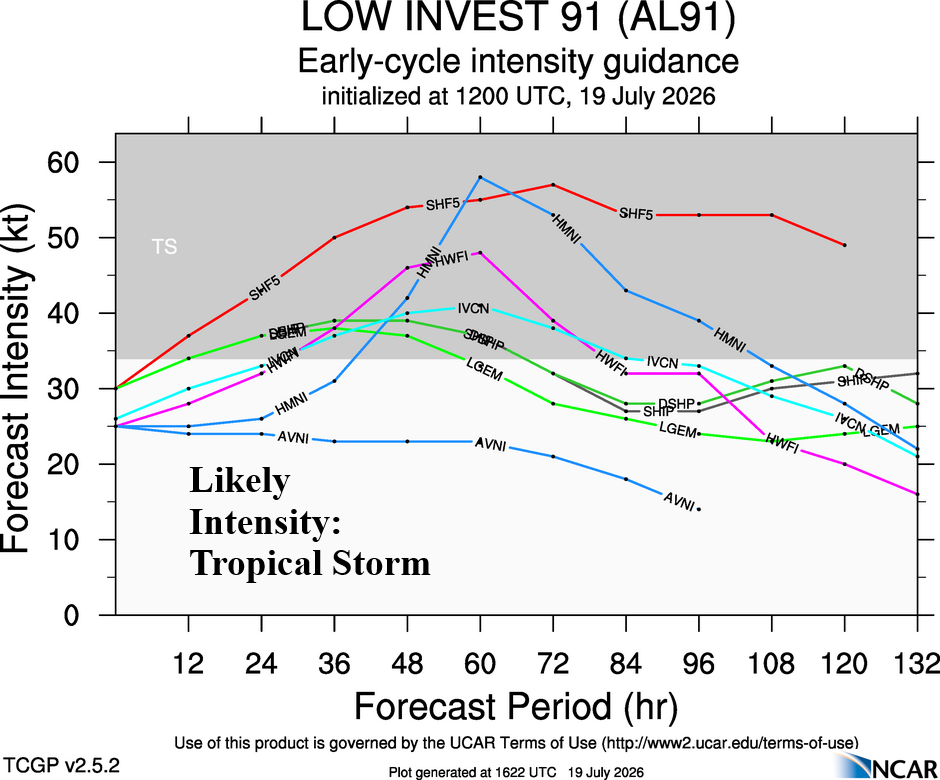
Fig. 4: Tropical cyclone model tracks and their 5-day intensity projection for TD2/TS Bertha.
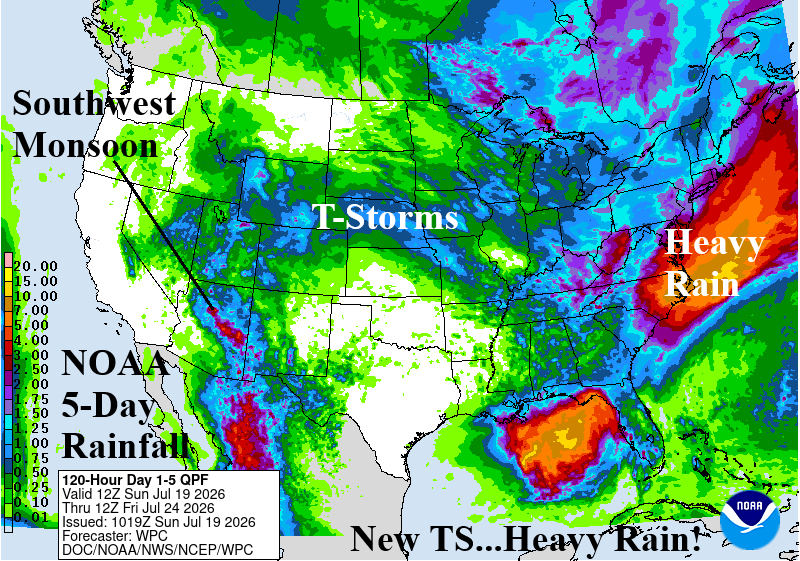
Fig. 5: NOAA/WPC 5-day quantitative rainfall forecast.
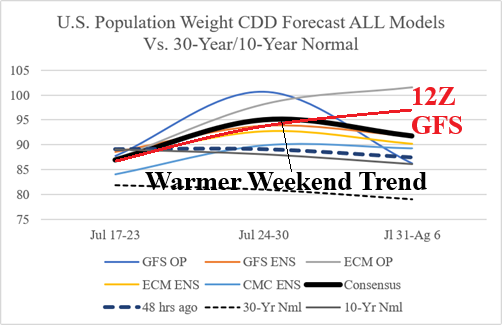
Fig. 6: U.S. population weight CDD forecast utilizing all operational models, their consensus, and comparison with 48 hours ago and normal.
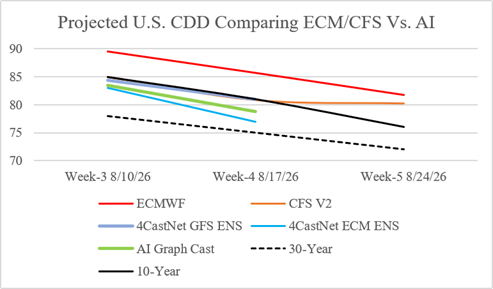
Fig. 7: U.S. projected CDD based on “weeklies” forecasts from ECM, CFS V2, and 3 AI models.