
Europe Drought to Receive Beneficial Rainfall
08/24/2025, 11:45 am EDT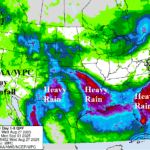
Heavy Rains Shift Across Southern U.S.
08/27/2025, 5:33 am EDT![]()
Climate Impact Company Midday Update
Issued: Tuesday August 26, 2025
Headline: Research comments. Cool 12Z GFS.
AI-generated meteorological forecast solutions are improving their skill. However, the explanation of how an AI-forecast is generated is a concern of many meteorologists and market analysts. At ECMWF, a NEW program titled XAI has been initiated to help unlock the AI “black box” to provide forecasters and users of weather information, an explanation of the AI-generated forecast. XAI will be used to help explain AIFS forecasts generated at ECMWF.
ECMWF has initiated a contest for all modelers to compete in a contest for predicting temperate, precipitation, and pressure for the week 2-6 timeframe. The project is an effort to help generate increasing accuracy in week 2-6 forecasts. Generally, forecast skill scores fade fast after 3 weeks with current operational forecasts. The project will feature all AI processes.
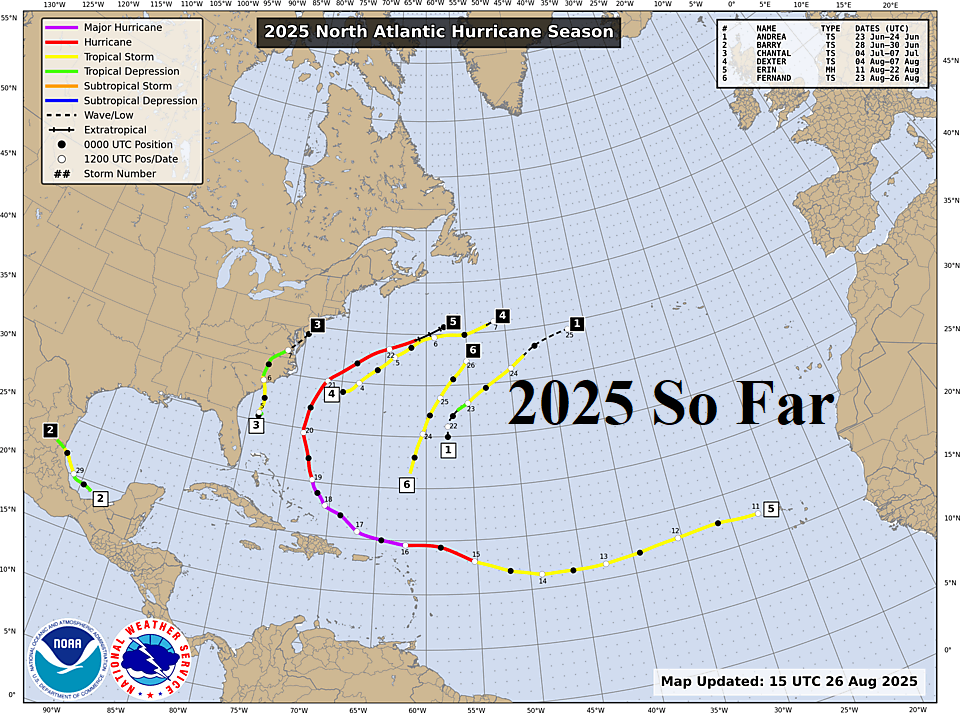
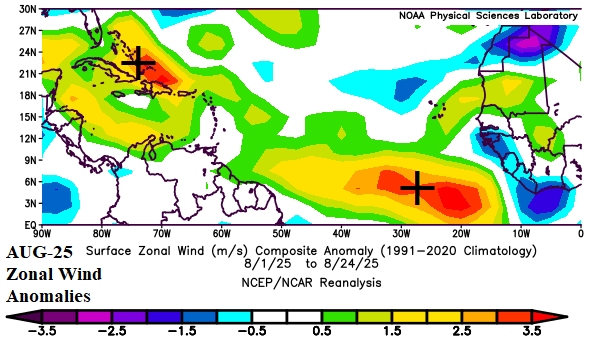
Fig. 1-2: The North Atlantic basin tropical cyclone activity so far and zonal wind anomalies during August identifying faster than normal trade winds (yellow/red).
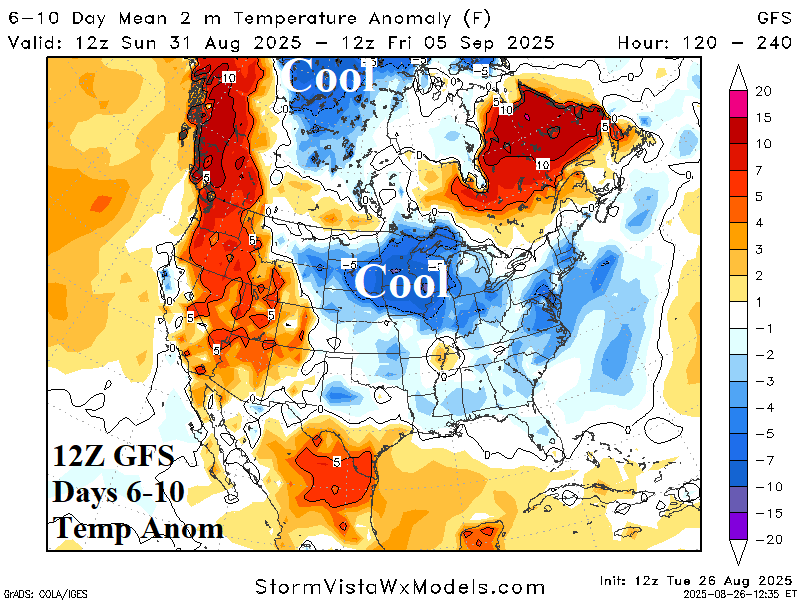
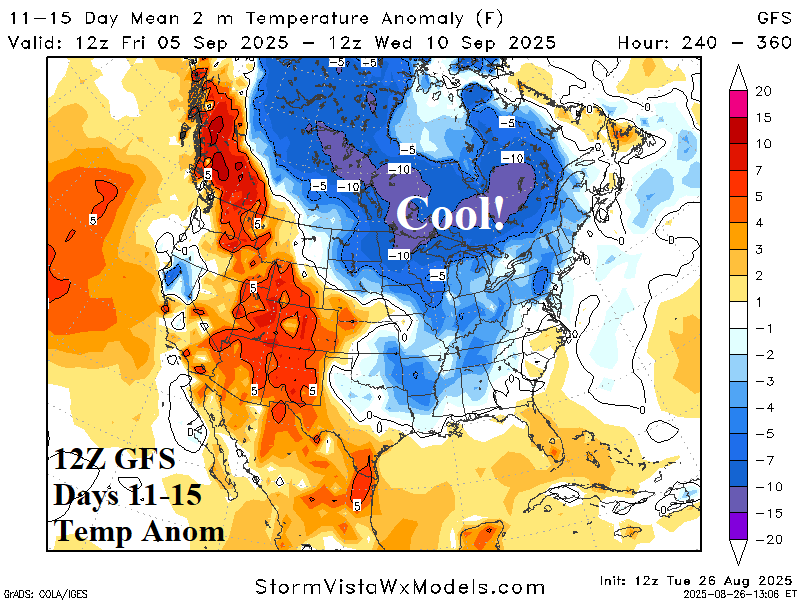
Fig. 3-4: The 12Z GFS 6-10-day temperature and precipitation forecast.
Discussion: Tropical cyclone activity during 2025 so far (Fig. 1) has featured tropical cyclone tracks mostly near and off the U.S. East Coast (Fig. 2). One possible explanation for lack of activity in the Gulf of Mexico, Caribbean Sea, and deep tropics is the persistent (much) stronger than normal trade winds preventing systems from developing. The midday 12Z GFS lingers cool anomalies across the eastern half of the U.S. in the 6-10-day period (Fig. 3) followed by cool air mass regeneration in the 11-15-day period extending from Canada to the East U.S. (Fig. 4). The tropics remain quiet although excessive rainfall is forecast along the Gulf Stream just off the U.S. East Coast.
| EIA End | Forecast | 12-Hour Change | 24-Hour Change | 30-Year Normal | 10-Year Normal |
| 8/28 | 59.0 | +0.4 | 0.0 | 68.6 | 74.5 |
| 9/4 | 52.2 | -4.0 | -2.8 | 62.4 | 68.7 |
| 9/11 | 53.0 | -6.3 | -13.8 | 54.4 | 61.6 |
Table 1: The midday 12Z GFS U.S. population weight CDD projections into mid-September.