
El Nino Climate Arrives/Intensifies Thanks to +GLAAM Forecast
06/26/2026, 9:50 am EDT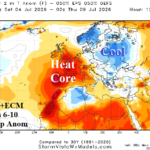
Worse-case Scenario for Europe as Southwest Europe Heat Regenerates, Pounces on France in Medium range
06/29/2026, 4:44 am EDT

Climate Impact Company U.S. Sunday Report
Issued: Sunday, June 28, 2026
Highlight: Week ending July 9, 2026, projected hottest week during July of past 10 years. Week 3-5 forecast ECM hot/AI cool bias continues.
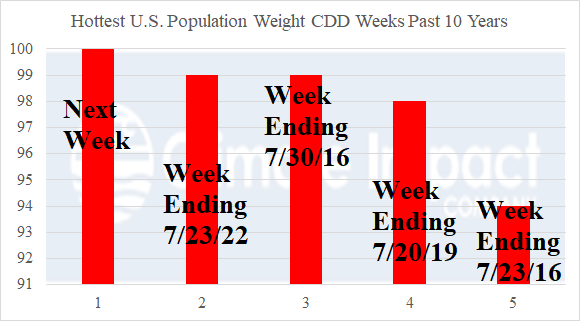
Fig. 1: NOAA U.S. population weight CDD for hottest weeks of past 10 years with the week ending July 9, 2026, projected to pass previous peaks.
Discussion: The consensus of all operational models and their U.S. population weight CDD projected for the week ending July 9, 2026, is 100 CDD which would eclipse the previous hottest week of the last 10 years at 99 CDD recorded for the week ending July 23, 2022, and July 30, 2016 (Fig. 1). During the potentially hottest week of July from the past 10 years, GFS ENS projects risk >100F throughout the Mid-Atlantic region likely to reach New York City, the entire western half of the Great Plains to Texas, and the Southwest U.S. including the San Joaquin Valley in Central California (Fig. 2). In a potential forecast change, some models, especially ECM, are extending the heatwave to the week of July 10-16 in the Northeast U.S. Corridor (Fig. 3).
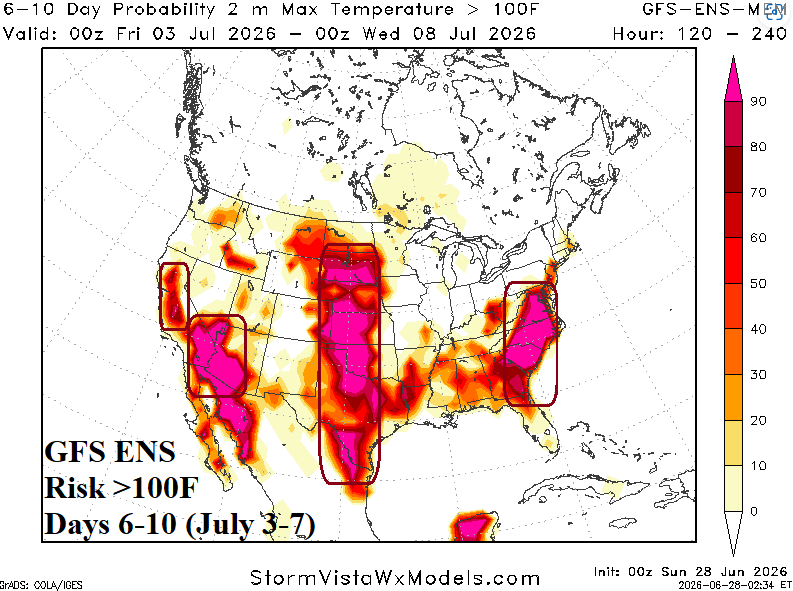
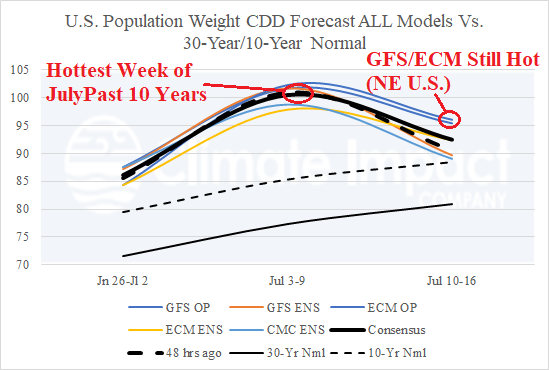
Fig. 2-3: GFS ENS risk >100F in the 6-10-day period and U.S. population weight CDD forecast through mid-July.
The eastward shift of excessive heat risk is underway in late June with Excessive Heat Warning and Heat Advisory areas covering the Midwest U.S. likely to expand into the East later this week (Fig. 4). The risk of >100F for this week is (also) impressive and includes the western Great Plains to Texas, and much of the East Coast (Fig. 5). High humidity occurs with excessive heat and heat index approaches 110F in the 100F+ risk areas.
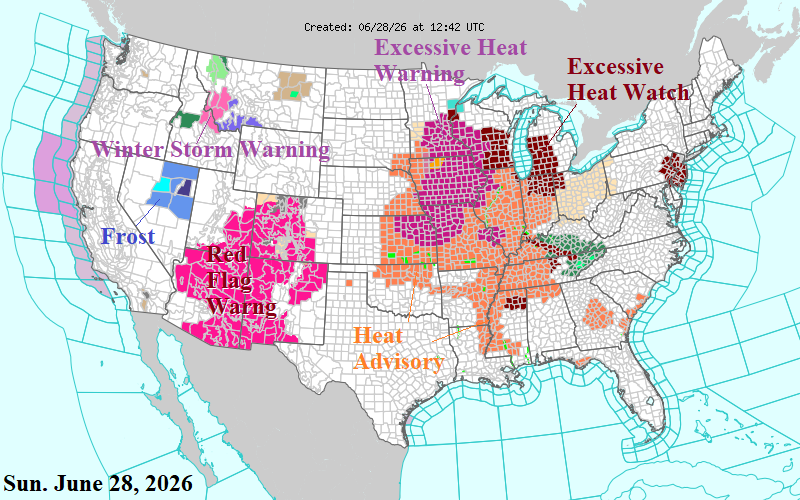
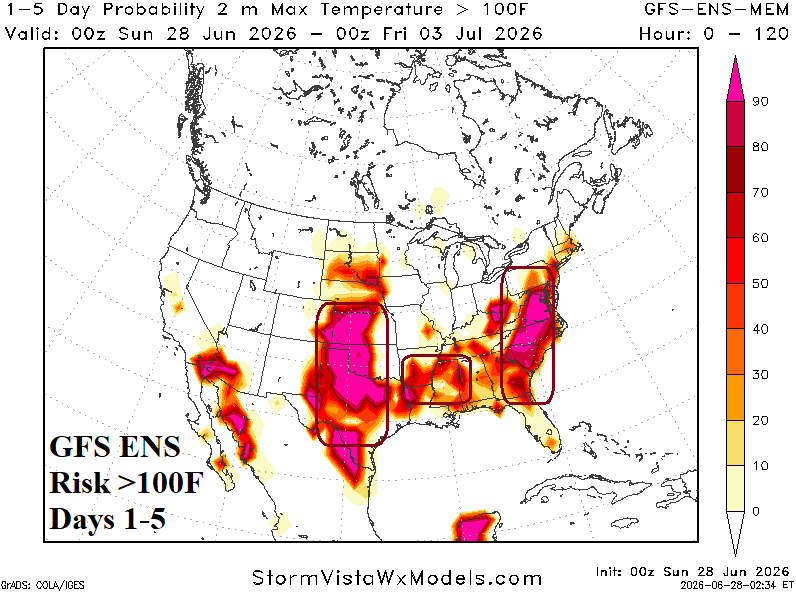
Fig. 4-5: Current NOAA/NWS weather watch, warning, and advisory areas plus this week’s GFS ENS risk of >100F.
The NOAA/WPC 7-day quantitative precipitation forecast emphasizes wet weather on top of the U.S. heat dome spreading across much of Canada (Fig. 6). Severe thunderstorms are limited to the Northern Great Plains and Carolinas today, Upper Midwest tomorrow and Tuesday.
In 15 days, heavily relied upon ECM ENS and AIFS ENS forecast important differences for the East U.S. The ECM ENS indicates potential for additional heat to sneak into the Northeast/Mid-Atlantic States from the Central U.S. source region (Fig. 7). Meanwhile, AIFS ENS amplifies a cooling trough in the East (Fig. 8). Climate signals marginally favor the cooler solution although using climate signals to justify AI forecasts is not appropriate. The week 3-5 forecast of U.S. population weight CDD projects persistent very hot ECMM forecasts while AI outlooks remain considerably cooler (Fig. 9).
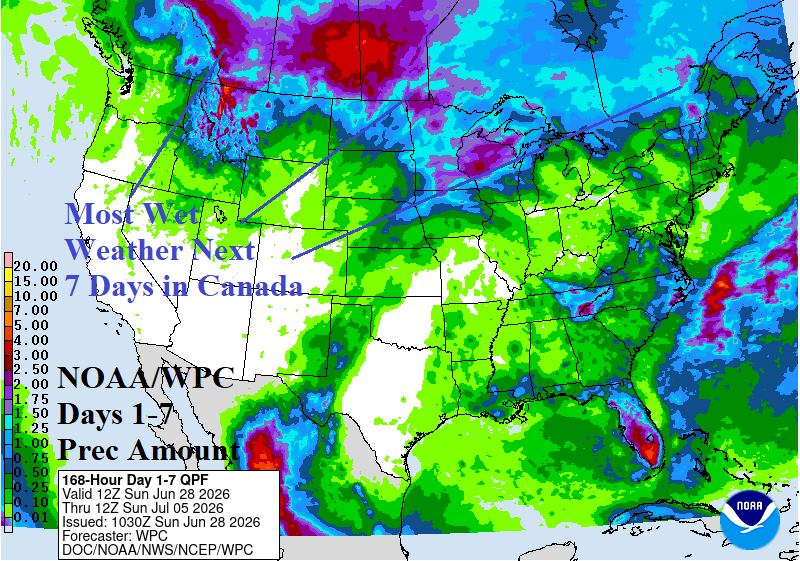
Fig. 6: NOAA/WPC 7-day quantitative precipitation forecast (QPF) for the U.S.
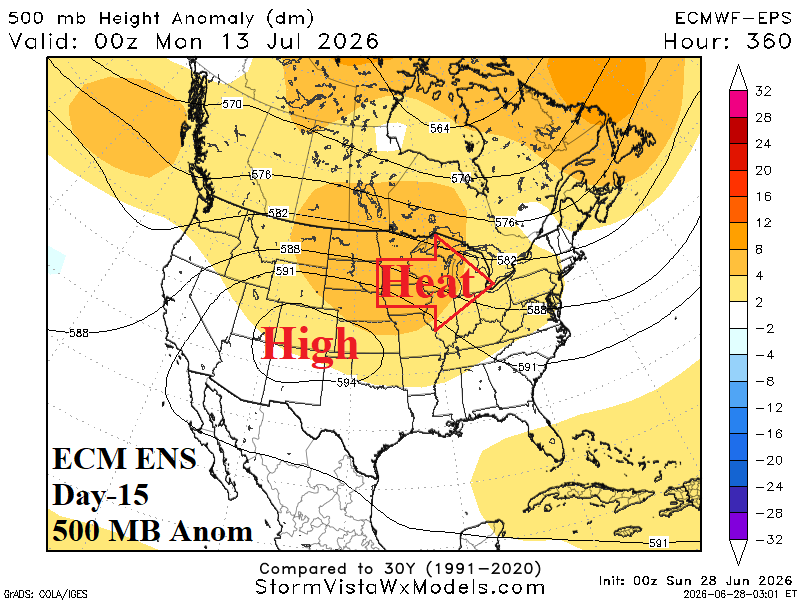
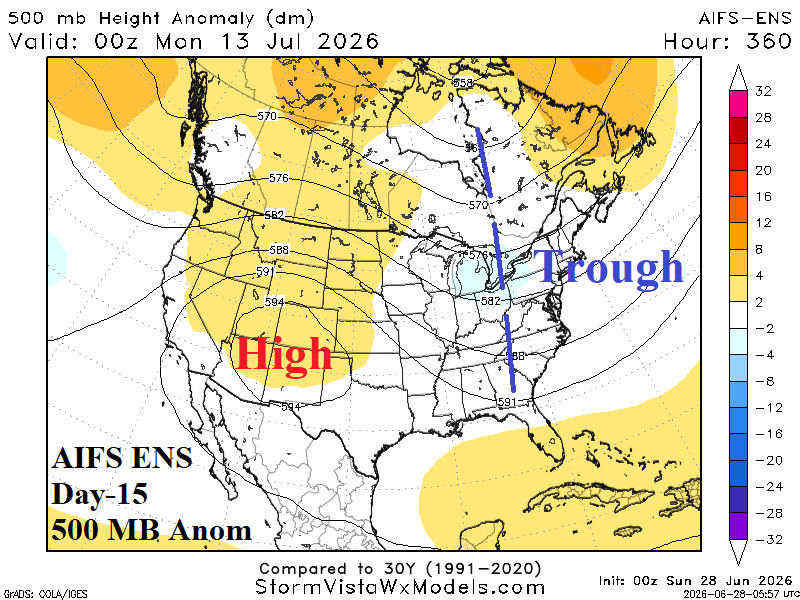
Fig. 7-8: ECM ENS and AIFS ENS day-15 500 MB forecasts.
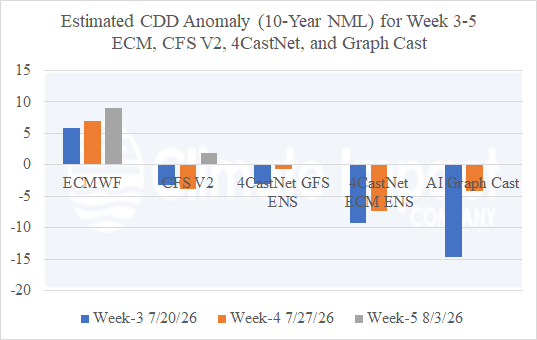
Fig. 9: Estimated U.S. population weight CDD for weeks 3-5 ahead utilizing ECM, CFS V2, and 3 AI models.