
Watching Waters Near the Bahamas in the 6-10-Day Period
07/31/2026, 1:38 pm EDT
Drought Development/Expansion Underway After a Dry Southwest/East July in Australia
08/04/2026, 5:56 am EDT
Climate Impact Company Early U.S. Report
Highlight: U.S. pattern features both excessive heat and heavy rainfall, likely to continue into mid-August.
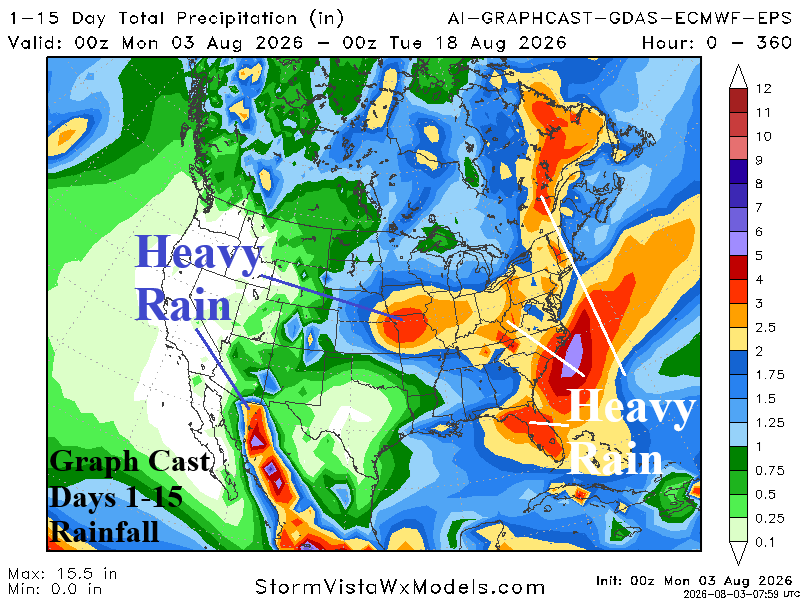
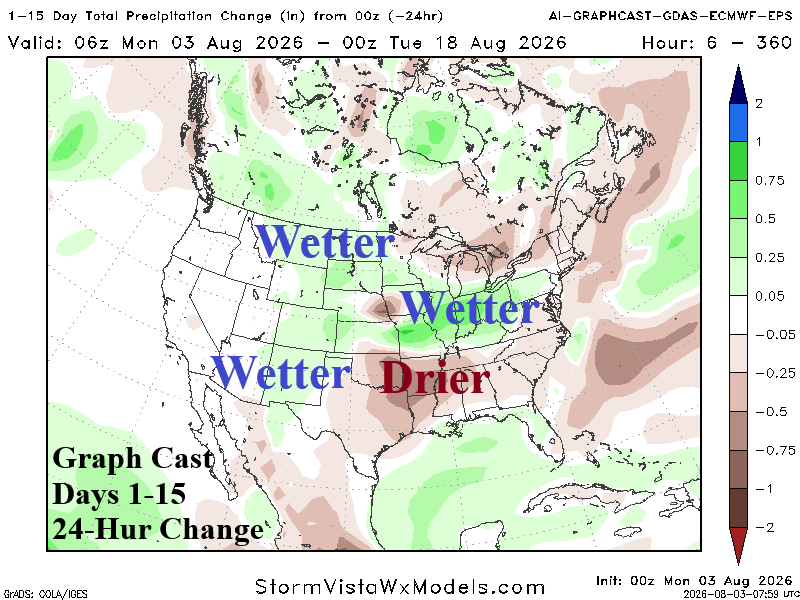
Fig. 1-2: The U.S. population weight CDD forecast utilizing all models, their consensus, and comparing with 24 hours ago and climatology.
Discussion: A wetter pattern is expected to develop during the next 15 days due to a Southwest U.S. wet monsoon moisture feed from 4-Corners arcing through the Missouri Valley and eastward. Graph Cast 15-day rainfall forecasts indicate heavy rain risk centered on the Missouri Valley and eastward throughout the Atlantic States (Fig. 1). The 24-hour change highlights the wetter trend in the Midwest States while the Mid-south U.S. is drier and hot (Fig. 2). Consequently, Midwest soil moisture increases while drought risk expands from Western Oklahoma eastward toward Arkansas and includes Northern Texas.
The U.S. population weight CDD forecasts reveal persistent hot forecasts for the week of August 6-12, the hottest week of summer 2026 in the U.S. (Fig. 3). The consensus of all models is similar with yesterday’s outlook through the middle third of August.
The latest NOAA/NWS weather watch, warning, and advisories reveal ongoing dangerous flooding in the Northern Mid-Atlantic region (Fig. 4). The flood risk will extend to Massachusetts today. Excessive Heat Warning’s are issued across the entire Desert Southwest as readings could approach 120F in some areas. Heat Advisories are expanding from California to Oregon. Red Flag Warnings for dangerous fire potential is indicated for the west/northwest Great Plains while Air Quality Alerts are indicated for most of the Interior Northwest.
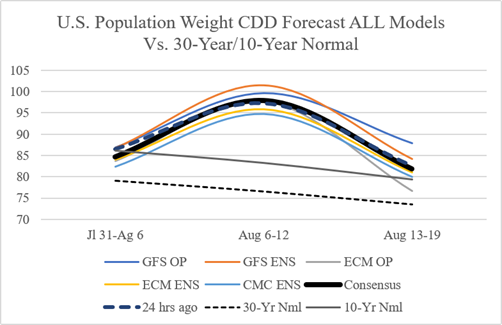
Fig. 3: The U.S. population weight CDD forecast utilizing all models, their consensus, and comparing with 24 hours ago and climatology.
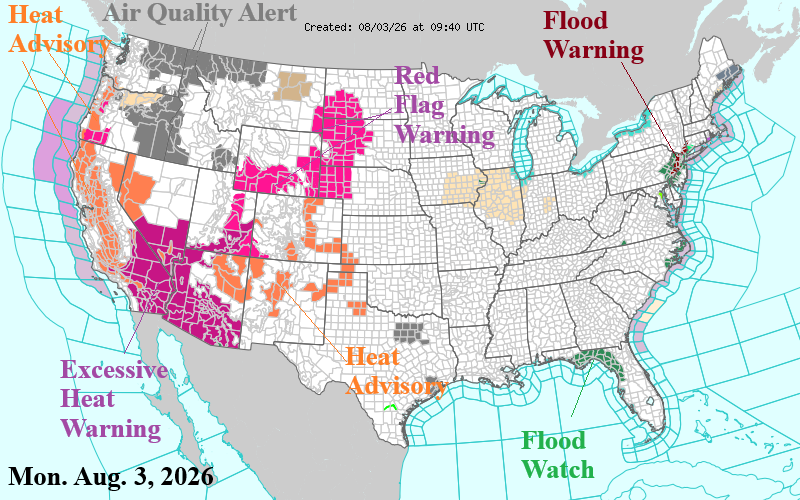
Fig. 4: The latest NOAA/NWS weather watch, warning, and advisory areas.