
U.S. Month 1-5 Ahead Wind Forecast
10/20/2026, 8:42 am EDT
Climate Impact Company Daily Feature
Issued: Sunday October 25, 2026
Highlight: What should I look at to identify increased pattern change/cold air risk?
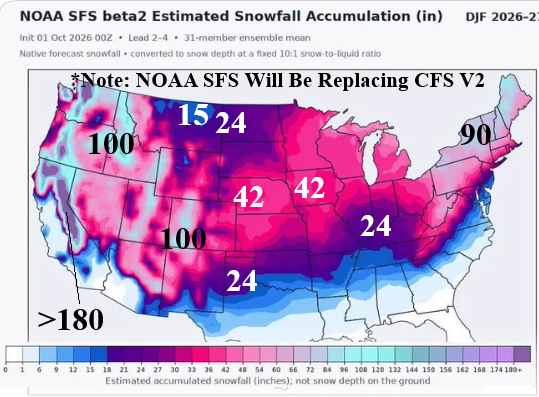
Fig. 1: The NOAA SFS Beta2 estimated snowfall DEC/JAN/FEB 2026-27.
Discussion: According to the still in test mode, NOAA SFS V2 model, unexpected buoyant snowfall amounts are projected for much of the U.S. in opposition to the implied lack of snow across the northern half of the U.S. based on mild forecasts (Fig. 1). The NOAA SFS V2 model is the replacement for the conventional CFS V2 (model) expected later next year. The forecast is striking for the amounts, particularly New York/Northern New England, Interior Northwest, and Midwest. Also, the southern extent of significant snowfall is striking. The outlook is not a snow on the ground projection but rather snowfall amount forecast for the 90-day period. What would cause this unusual amount of snowfall for an El Nino climate? The expected vigorous Southern U.S. storm track ignited by Super El Nino has a farther north reach of attendant precipitation (rather than wet South/dry North as many forecasts indicate). The storm track features unusually low pressure enabling locally generated cold air to cause snowfall. Another possible feature is stratospheric warming events that can temporarily produce arctic air in Canada drawn into the storm track to cause snow. The two potential explanations for the snowfall forecast by NOAA SFS V2 would be rare for an El Nino event. One reason for the warm Northern U.S. winter forecasts is lack of snow on the ground. The NOAA SFS V2 forecast suggests that warm bias is limited.
What to look for as cold season is about to begin to identify pattern change and potential cold air outbreaks, which according to NOAA SFS V2, may be higher than current expectations. One of the lead diagnostics is snow cover and snow cover anomalies observations and trends. If snow cover is advancing (or developing), a built-in cold bias to the pattern across and downwind of the snow cover advancement trend evolves. Conversely, just south of snow cover during meteorological winter, mild temperatures over-achieve.
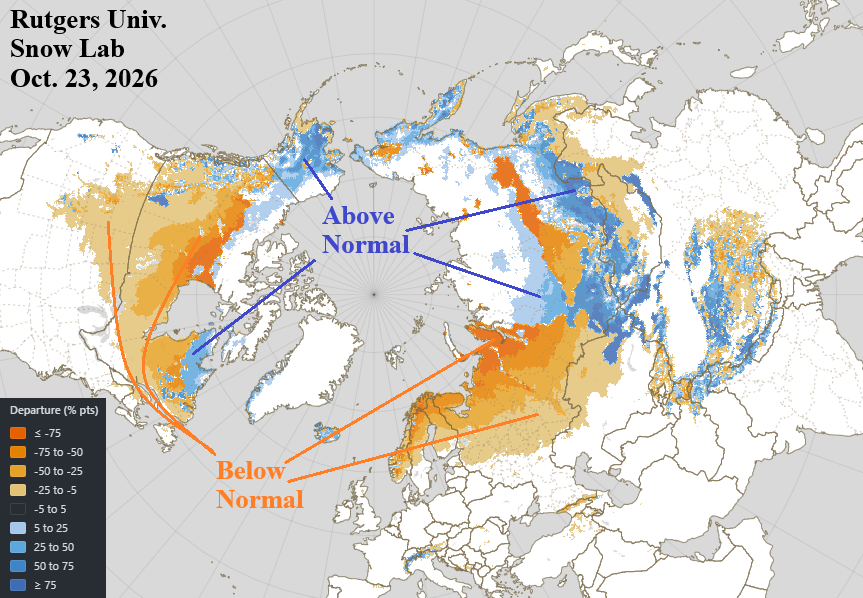
Fig. 2: The Rutgers University northern hemisphere snow cover anomalies observation for Oct. 23, 2026.
The latest snow cover anomalies analysis in an updated version presented by the Rutgers University Snow Laboratory, North America and Europe snow cover is well behind schedule while Russia has (mostly) normal snow cover with above normal amount south of Russia (Fig. 2). The 15-day northern hemisphere temperature anomaly forecast by WX NEXT V3 almost exactly parallels snow cover…no snow very warm, snow on the ground cold (Fig. 3).
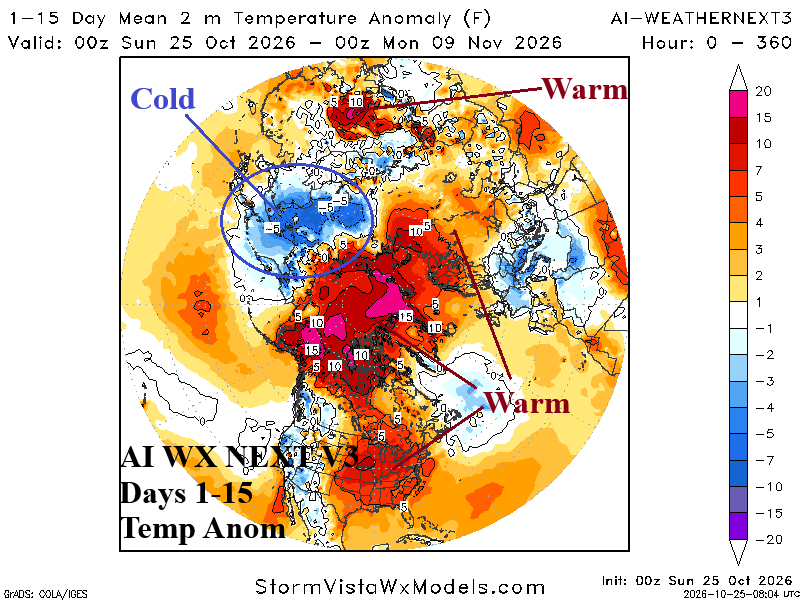
Fig. 3: AI WX NEXT V3 15-day temperature anomalies forecast for the northern hemisphere.
The two leading catalysts to pattern change during meteorological winter are Madden Julian oscillation (MJO) and stratospheric warming, essentially tropical or polar forcing. There are different schools of thought on MJO. The MJO is limited during El Nino or MJO interacts with El Nino. Climate Impact Company (CIC) prefers the second option. When MJO phase_1/phase_2 is projected, a warm weather system is moving east of North America and followed by a cold outbreak from Canada. Will Canada have any anomalous cold air during winter 2026-27 as most climate forecasts are El Nino-enforced warmer than normal. So, while MJO is active, the interaction of MJO and El Nino climate is different. Currently, MJO is emerging in the tropical Indian Ocean shifting from phase_2 to phase_3 (Fig. 4). MJO phase_3 is a warm signal for the U.S. and stormy across the Southwest States and a good match for most current 1-2-week outlooks.
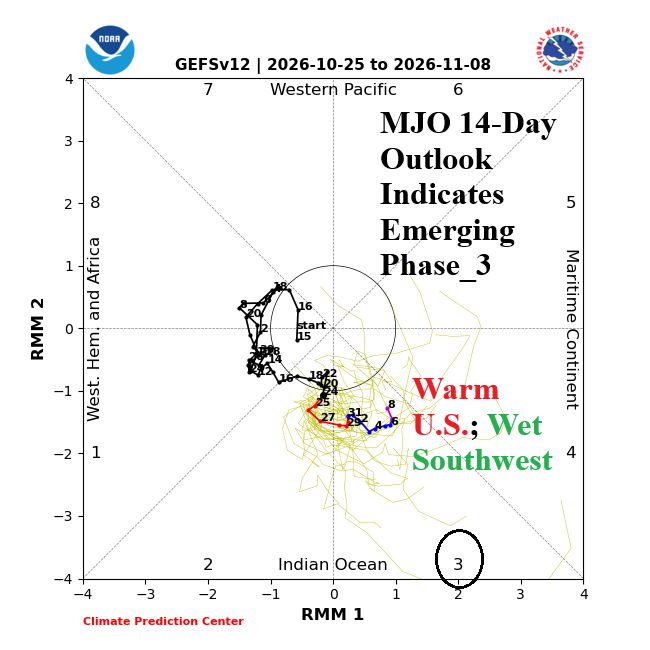
Fig. 4: NOAA 14-day Madden Julian oscillation forecast.
Finally, the North Atlantic oscillation (NAO) is important. The NAO has lost some of its reliability during the past 1-2 decades due to the influence on the atmosphere of warming middle/high latitudes. For this reason, other climate indices tracking “polar vortex” potential, such as East and West Pacific oscillation (EPO/WPO) have increased recognition. However, during winter 2026-27, heavier snow cover supporting cold air is projected for northeastern North America which could increase the effectiveness of -NAO patterns, when present, to cool the East U.S. Coupled with El Nino climate, -NAO may favor storminess over col air. The current NAO forecast matches the warming intent of the MJO outlook EXCEPT days 11-15 when a trend toward negative phase is indicated (Fig. 5). In the El Nino climate, Pacific forcing is too strong for -NAO synoptic patterns to form within the 15-day forecast.
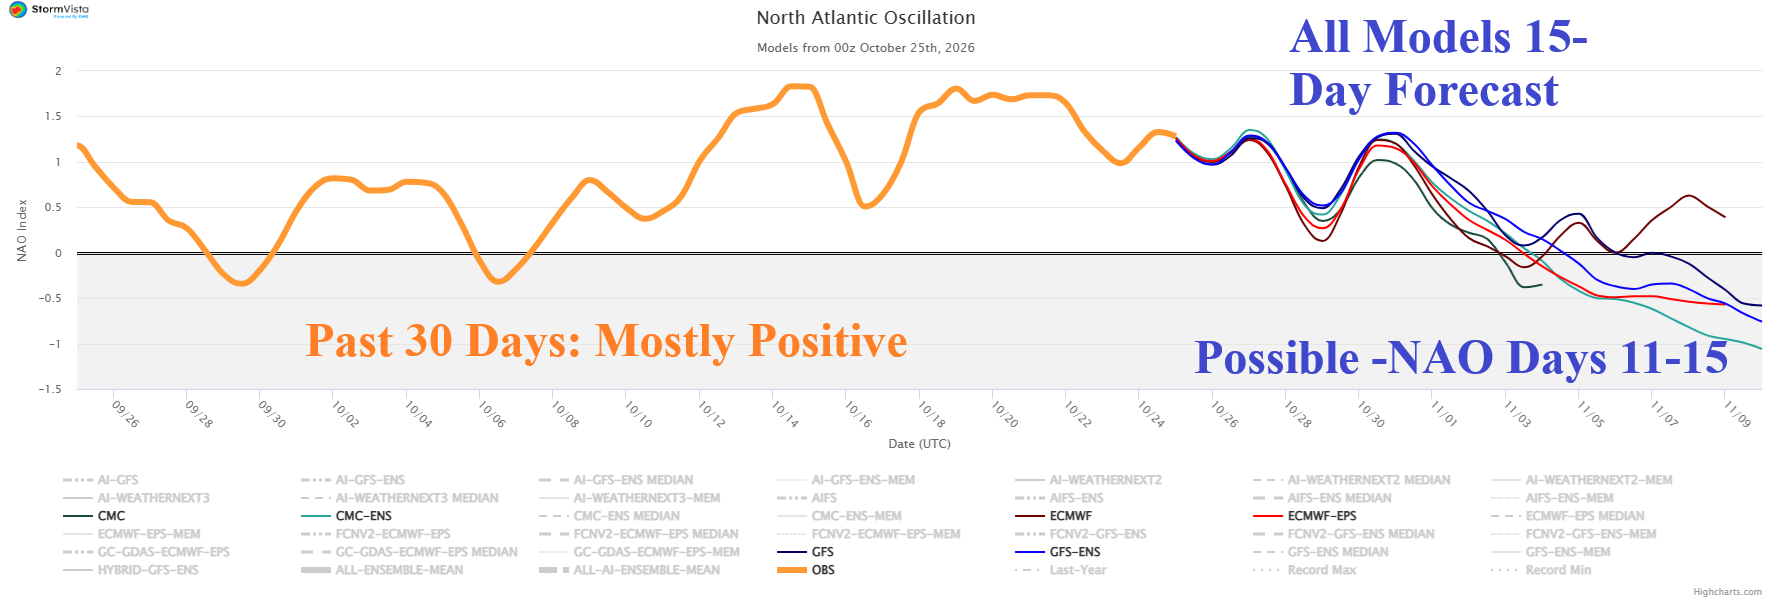
Fig. 5: 30-day observations of the North Atlantic oscillation index and 15-day forecast.