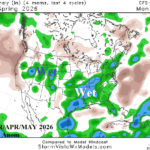
Comparing U.S. and Europe Springtime Rainfall Forecasts
02/27/2026, 9:25 am EST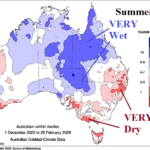
Summer 2025-26 Featured Climate Extremes Across Australia
03/04/2026, 8:19 am EST
Climate Impact Company ENSO Climate Diagnostics
Issued: Tuesday February 3, 2026
Highlight: Upper ocean heat in the East Pacific is immense. But atmosphere still in La Nina mode. Can an east-shifting MJO during mid-March encourage El Nino trend?
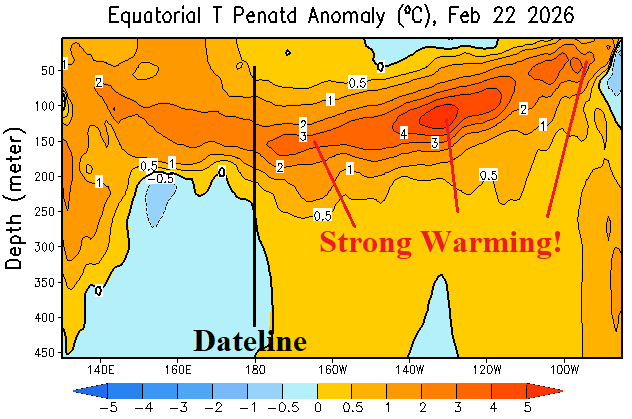
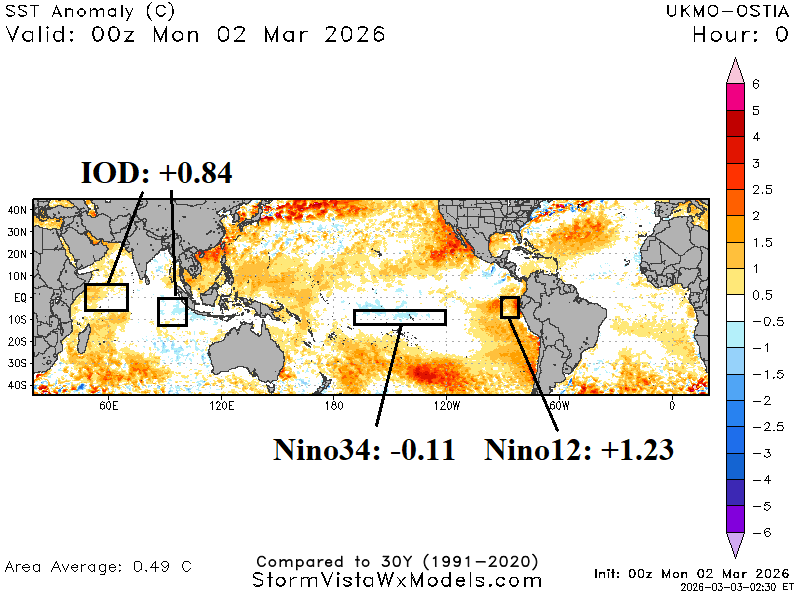
Fig. 1-2: The subsurface equatorial East Pacific is very warm (and warming). Only Nino12 (off the northwest coast of South America) has warmed significantly.
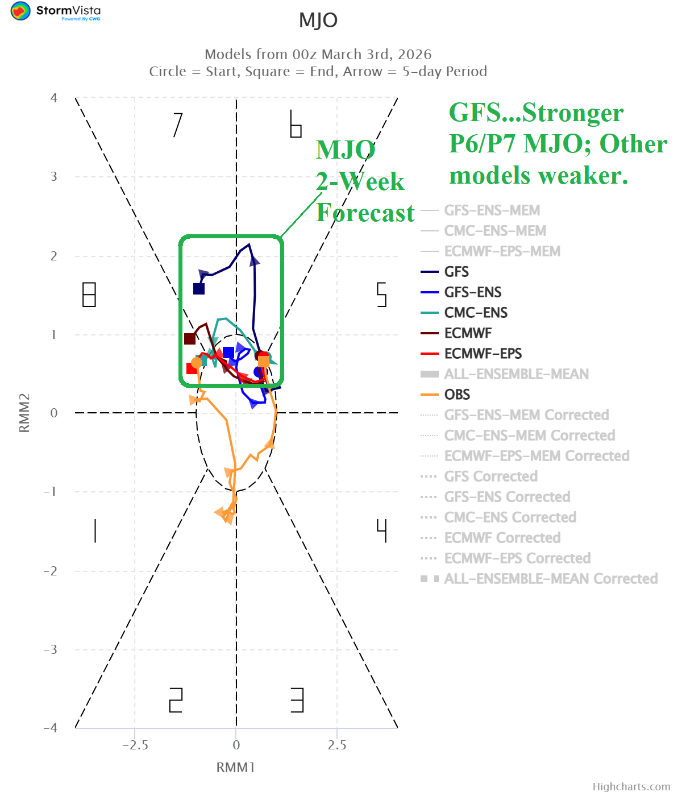
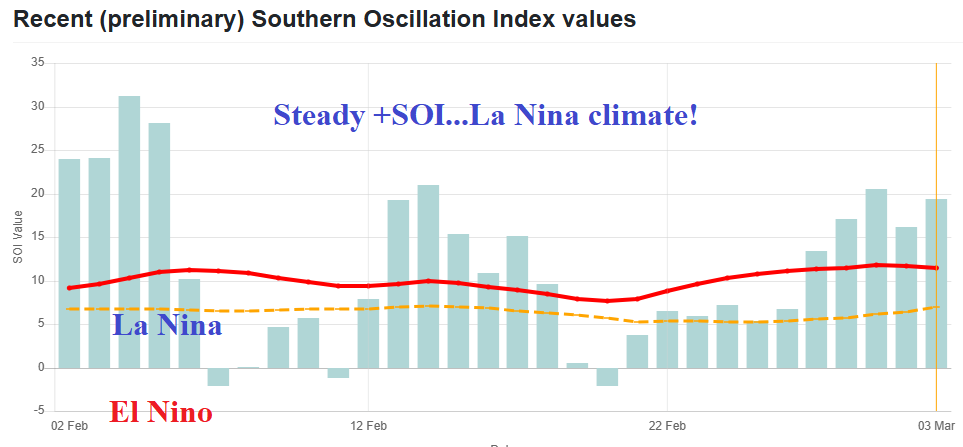
Fig. 3-4: The 15-day Madden Julian oscillation forecast reveals eastward progression from Maritime Continent to near the Dateline with weak intensity except the stronger GFS. Daily southern oscillation index is positive, implying a lingering La Nina climate.
Discussion: The eastern equatorial East Pacific subsurface is impressively warm and continues to warm, the strongest (warm) signature since Q2/2023 (Fig. 1). However, at the surface, only the Nino12 region has warmed significantly (+1.23C). The Nino34 region remains slightly cooler than normal (-0.11C) confirming neutral ENSO phase (Fig. 2). The convection phase of the Madden Julian oscillation (MJO) is located across Maritime Continent. Forecasts indicate MJO shifts east toward and just past The Dateline over the next 2 weeks (Fig. 3). Intensity is weak according to most operational models except the GFS. The significant upper ocean heat could justify the stronger GFS forecast and increase the influence of MJO on North and South America weather patterns for mid-March plus encourage a faster El Nino trend. A diagnostic to determine strength of MJO over the next 2 weeks is the southern oscillation index (SOI). Daily SOI reveal (mostly) positive phase revealing the atmosphere continues La Nina tendencies (Fig. 4). If the SOI shifts to negative phase in the coming days, a stronger MJO (than forecast) will evolve. Right now, most models maintain +SOI and downplay MJO intensity through the middle third of March. Climate Impact Company suspects a stronger MJO. Global SSTA forecasts utilizing the International Multi-Model Ensemble (Fig. 5) indicate El Nino development by June with an ongoing positive phase Indian Ocean dipole (+IOD).
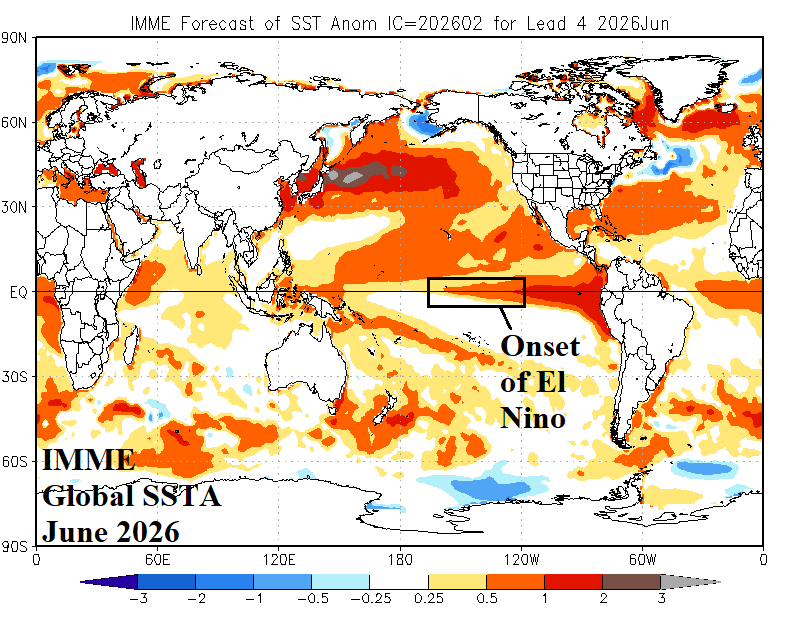
Fig. 5: The global SSTA forecast utilizing the International Multi-Model Ensemble indicates onset of El Nino by June.