
New England Whacked With a “Cold Blob” Storm
05/29/2026, 1:46 pm EDT
South America Cold Weather Threat Mid-June
06/03/2026, 1:47 pm EDT

Climate Impact Company U.S. Sunday Report
Issued: Sunday, May 31, 2026
Highlight: MJO activates, causes El Nino climate. May cause a cooler shift in East in the extended range.
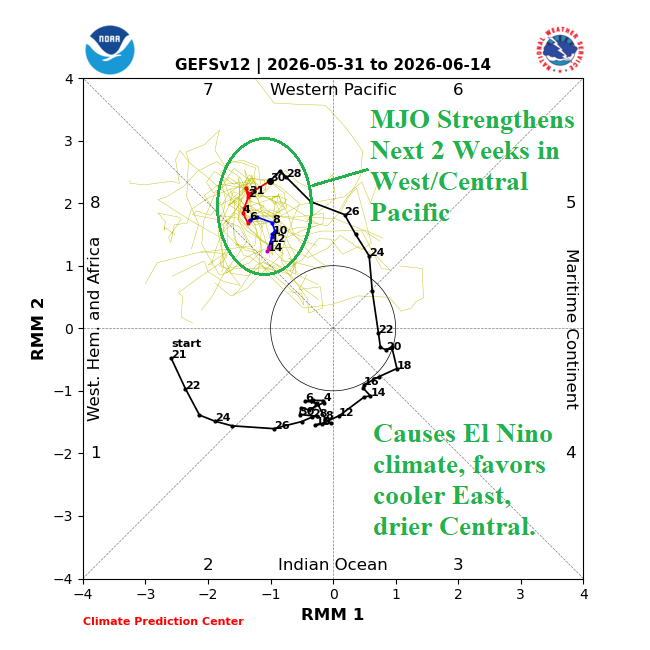
Fig. 1: Latest 14-day Madden Julian oscillation forecast indicates strengthening phase_7 causing significant impacts on the U.S. weather pattern and ENSO.
Discussion: The Madden Julian oscillation has ignited across the equatorial Pacific Ocean likely to remain intense during the next 2 weeks (Fig. 1). The outlook indicates MJO is withing phase_7 implying a cooler East U.S./warmer West U.S. thermal regime with wet weather biased toward the southern states. Additionally, MJO phase_7 is supportive of a developing El Nino climate as demonstrated by recent and an intense negative southern oscillation index. Therefore, the 12Z GFS medium range temperature anomaly forecast is preferable maintaining heat in the 6-10-day period (Fig. 2) but cooler solution in the East during the 11-15-day period (Fig. 3). The 6-10-day forecast is hot and risk of >90F is widespread covering the entire Southern U.S. and reaching northward to affect most of the Great Plains and Mid-Atlantic States (Fig. 4). The risk of >100F is evident across the southwestern Great Plains, southern portions of Texas, and the Desert Southwest (Fig. 5). The U.S. population weight CDD forecast at midday is hotter for next week reversing cooler to near normal the week of June 12-18 (Fig. 6). Dynamic models (ECM and CFS) maintain the warm U.S. pattern while AI models carry the cooler 12Z GFS forecast solution into later June (Fig. 7).
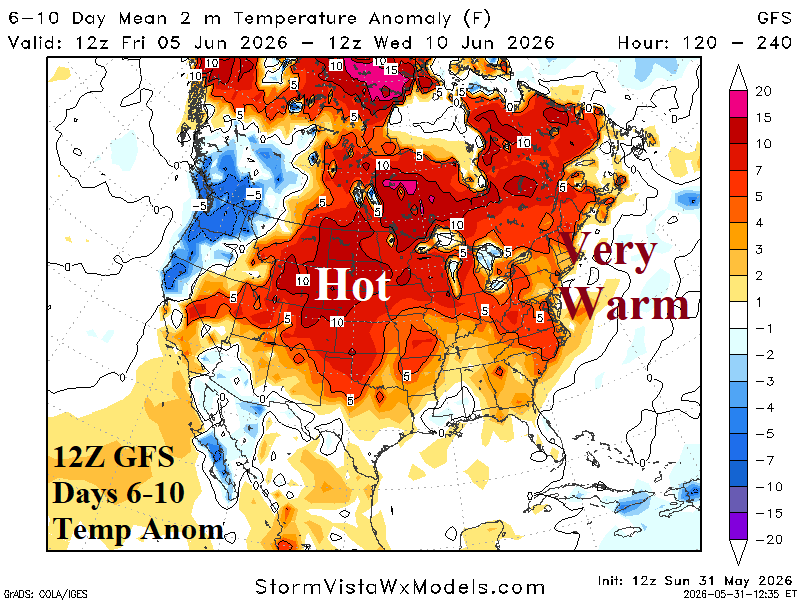
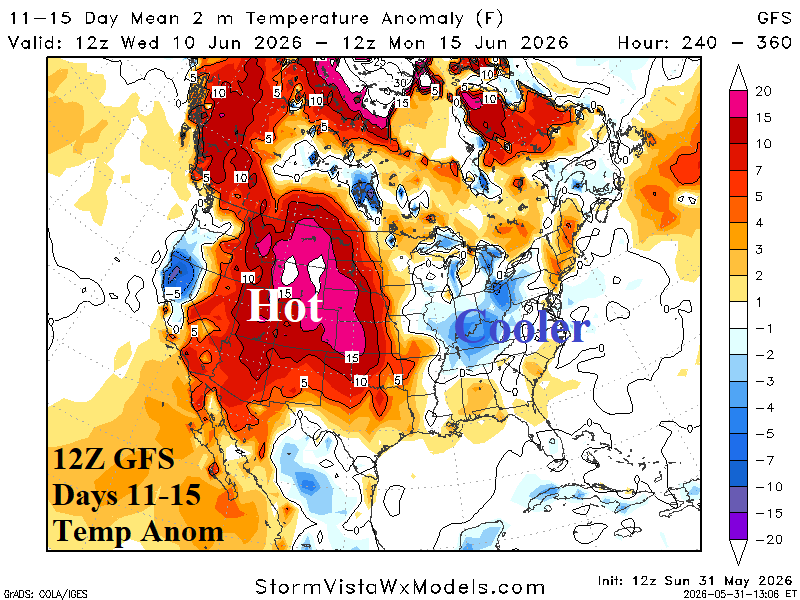
Fig. 2-3: 12Z GFS U.S. medium range temperature anomaly forecast.
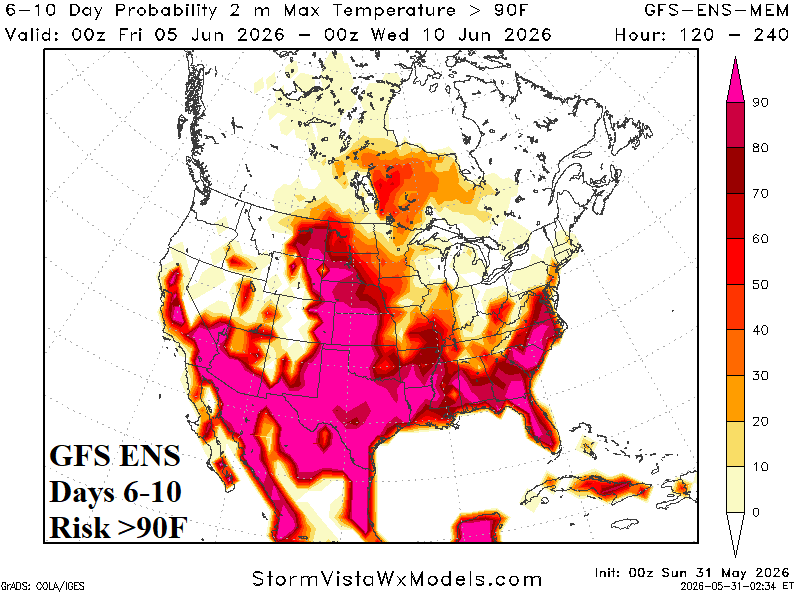
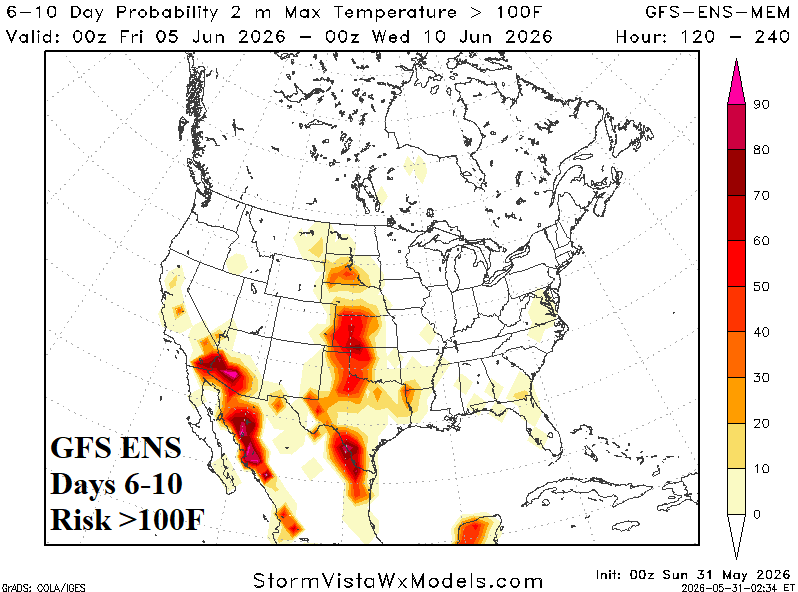
Fig. 4-5: GFS ENS risk of >90F and >100F during the 6-10-day period.
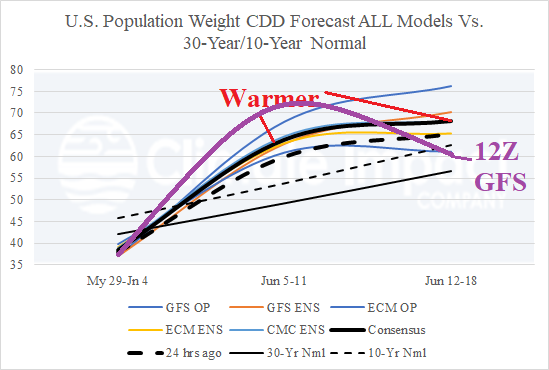
Fig. 6: U.S. population weight CDD forecast utilizing all models, their consensus, and comparison with 24 hours ago and 30-year/10-year climatology.
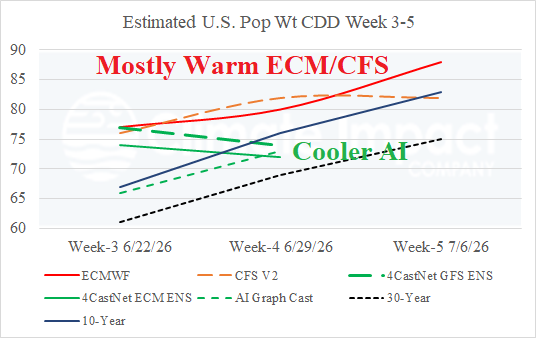
Fig. 7: Estimated U.S. population weight CDD for the week 3-5 ahead time period utilizing ECM/CFS Vs. 3 AI models.


Climate Impact Company U.S. Sunday Report
Issued: Sunday, May 31, 2026
Highlight: MJO activates, causes El Nino climate. May cause a cooler shift in East in the extended range.
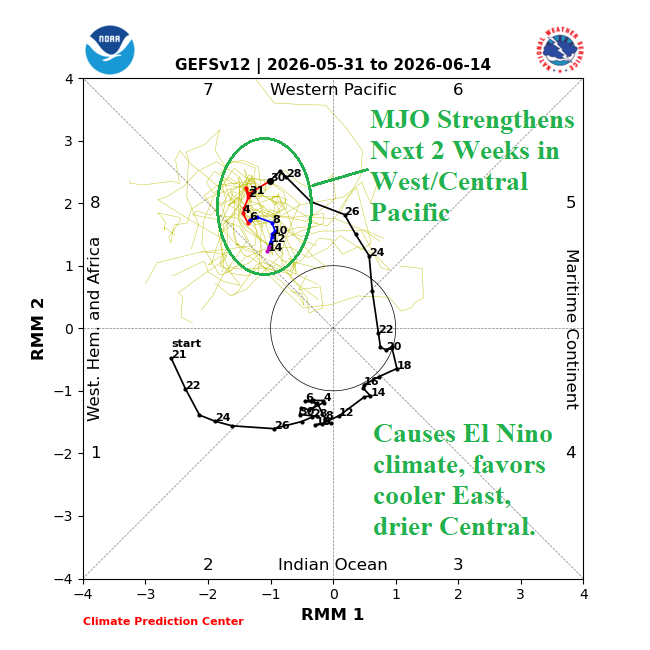
Fig. 1: Latest 14-day Madden Julian oscillation forecast indicates strengthening phase_7 causing significant impacts on the U.S. weather pattern and ENSO.
Discussion: The Madden Julian oscillation has ignited across the equatorial Pacific Ocean likely to remain intense during the next 2 weeks (Fig. 1). The outlook indicates MJO is withing phase_7 implying a cooler East U.S./warmer West U.S. thermal regime with wet weather biased toward the southern states. Additionally, MJO phase_7 is supportive of a developing El Nino climate as demonstrated by recent and an intense negative southern oscillation index. Therefore, the 12Z GFS medium range temperature anomaly forecast is preferable maintaining heat in the 6-10-day period (Fig. 2) but cooler solution in the East during the 11-15-day period (Fig. 3). The 6-10-day forecast is hot and risk of >90F is widespread covering the entire Southern U.S. and reaching northward to affect most of the Great Plains and Mid-Atlantic States (Fig. 4). The risk of >100F is evident across the southwestern Great Plains, southern portions of Texas, and the Desert Southwest (Fig. 5). The U.S. population weight CDD forecast at midday is hotter for next week reversing cooler to near normal the week of June 12-18 (Fig. 6). Dynamic models (ECM and CFS) maintain the warm U.S. pattern while AI models carry the cooler 12Z GFS forecast solution into later June (Fig. 7).
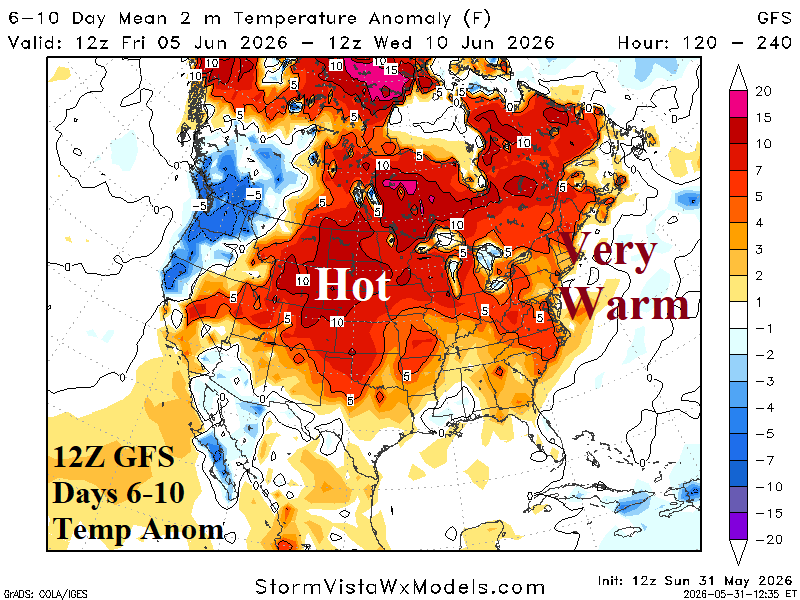
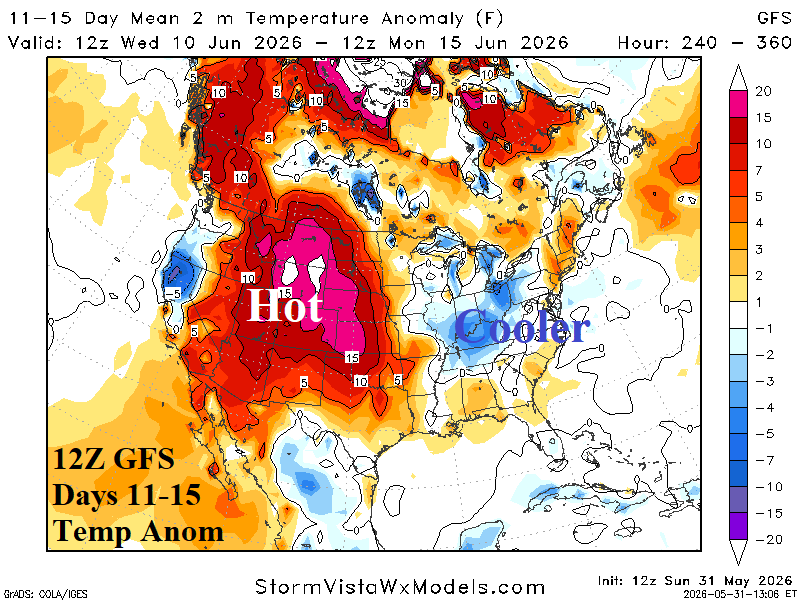
Fig. 2-3: 12Z GFS U.S. medium range temperature anomaly forecast.
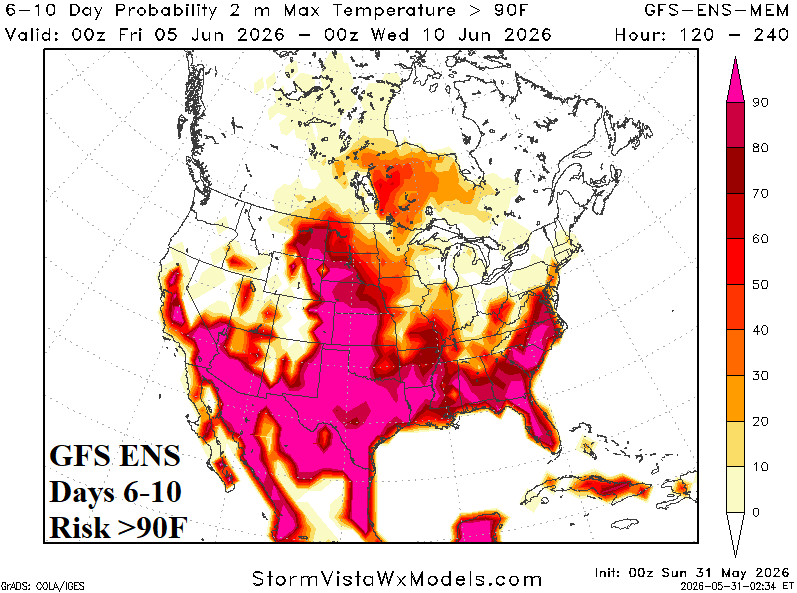
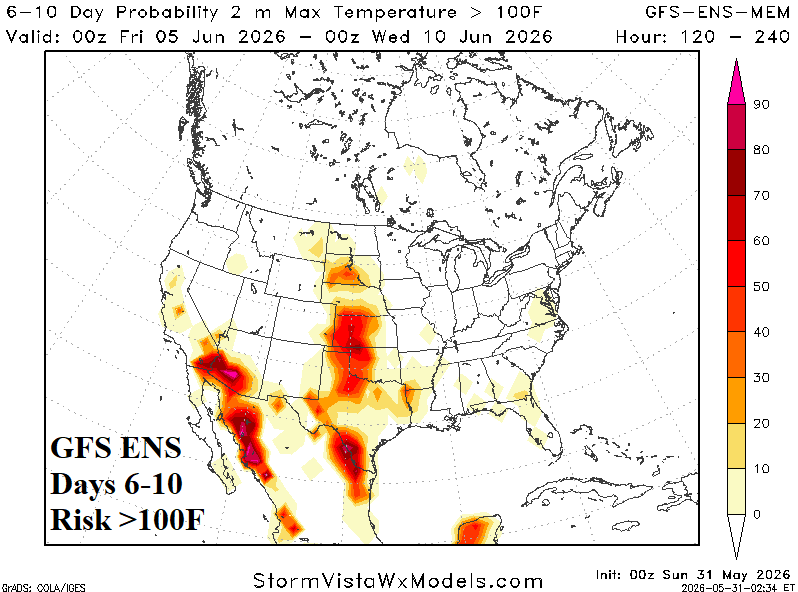
Fig. 4-5: GFS ENS risk of >90F and >100F during the 6-10-day period.
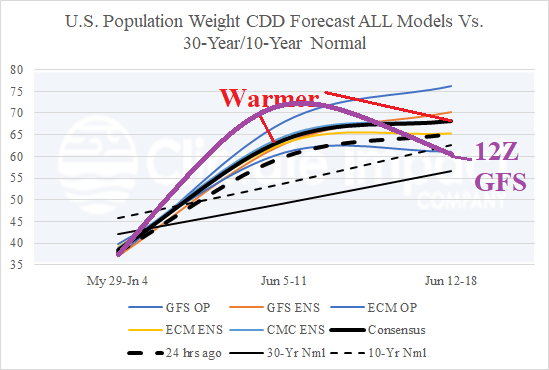
Fig. 6: U.S. population weight CDD forecast utilizing all models, their consensus, and comparison with 24 hours ago and 30-year/10-year climatology.
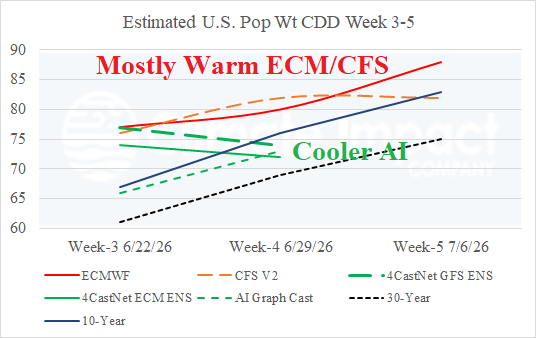
Fig. 7: Estimated U.S. population weight CDD for the week 3-5 ahead time period utilizing ECM/CFS Vs. 3 AI models.