
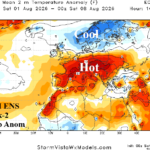
Slowly, Europe Heatwave Shifts Eastward in August
07/25/2026, 6:54 am EDT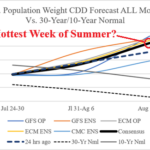
U.S. Population Weight CDD Forecasts for August 6-12 are Hot!
07/30/2026, 5:03 am EDT
Climate Impact Company AG Hot Spot
Issued: Tuesday July 28, 2026
Highlight: Rains this week Western Corn Belt; Heat/dryness to follow.
Discussion: Currently, U.S. soil moisture anomalies analysis reveals important dryness emerging across the North-central U.S., continuing across the West U.S. to the western Great Plains, and persisting on the East Coast (Fig. 1). The July soil moisture change is much drier in the Ohio Valley and parts of the northern Great Plains and south/southeastern Great Plains (Fig. 2). U.S. Crop Areas are generally OK, but concerns are emerging, due to persistent heat, that some crop areas may enter a danger zone during August, particularly the Western Corn Belt.
The concern is warranted by equally combining GFS and ECM operational models from overnight. This week, hot weather regenerates across the northern, western and southern Great Plains (Fig. 3). Thundershowers provide excellent rainfall amount with aerial coverage across the North-central U.S. this week (Fig. 4). However, the medium range forecast, when equally combining GFS and ECM becomes scary for the Western Corn Belt due to widening heat and much drier conditions in the 6-10-day period (Fig. 5-6) likely to continue in the 11-15-day forecast (Fig. 7-8).
Surprisingly, GFS ENS scores number 1 with U.S. 16-30-day temperature forecasts. Revealed is a hot second half of August in the lest outlook with attendant widespread dryness in the Great Plains (Fig. 9-10).
Crop ratings are likely to shift downward given the heat and dryness occurring much of the time during the next 4 weeks. The outlook is not straightforward as AI models are not as hot or dry across the Northern U.S.
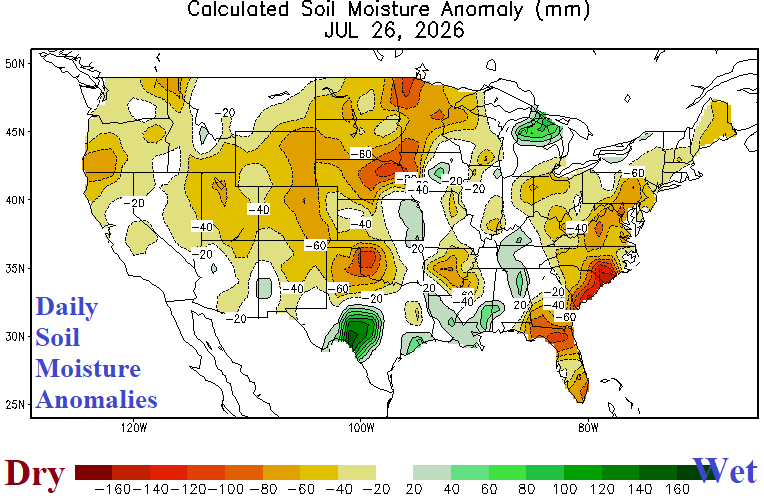
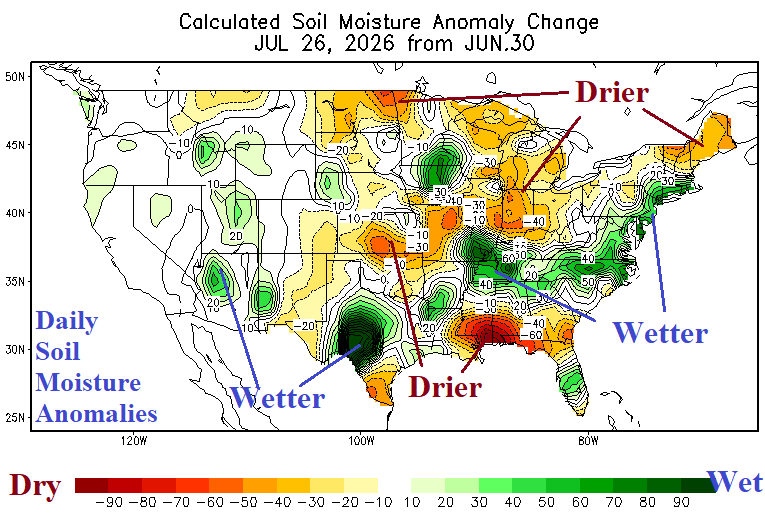
Fig. 1-2: U.S. soil moisture anomalies analysis and July change.
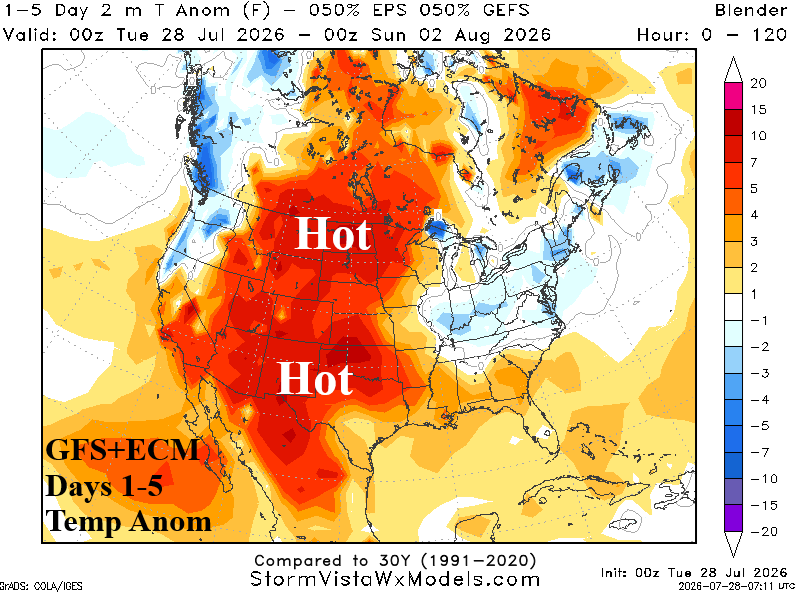
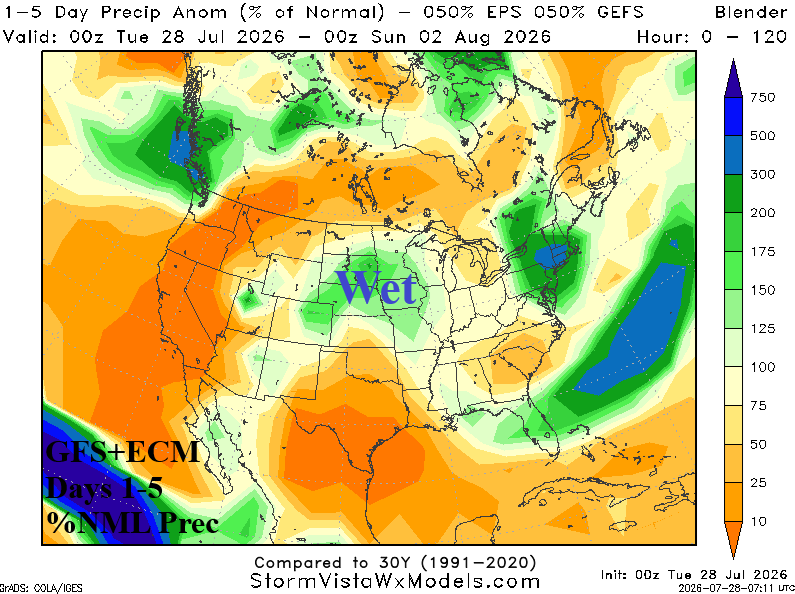
Fig. 3-4: Equally combining GFS and ECM to produce the U.S. 1-5-day temperature anomaly and percent normal rainfall forecast.
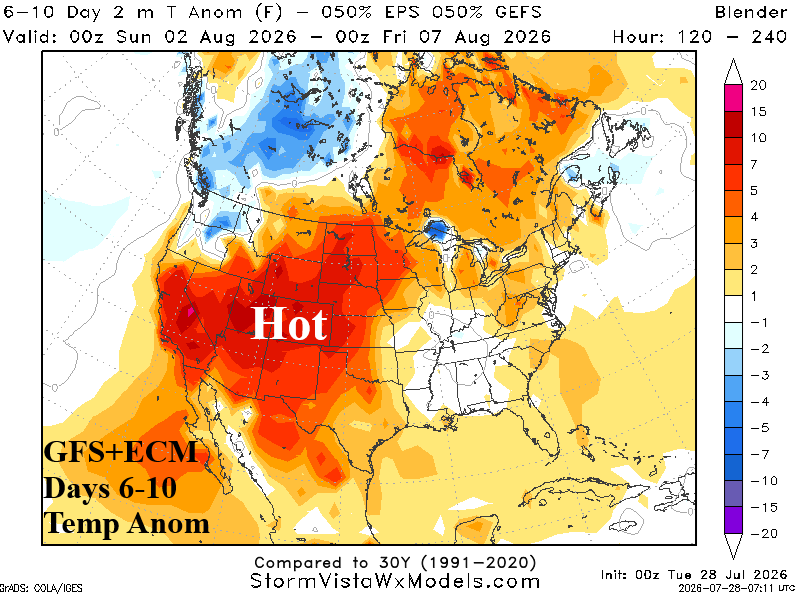
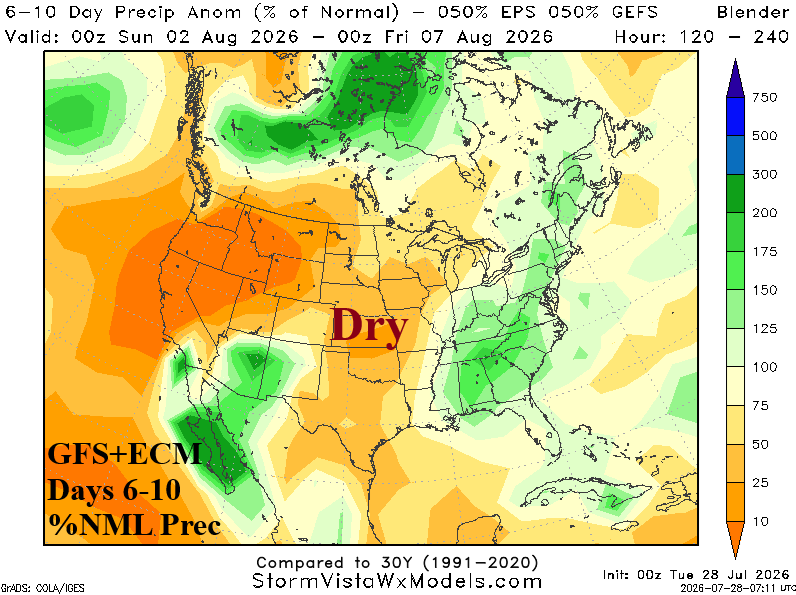
Fig. 5-6: Equally combining GFS and ECM to produce the U.S. 6-10-day temperature anomaly and percent normal rainfall forecast.
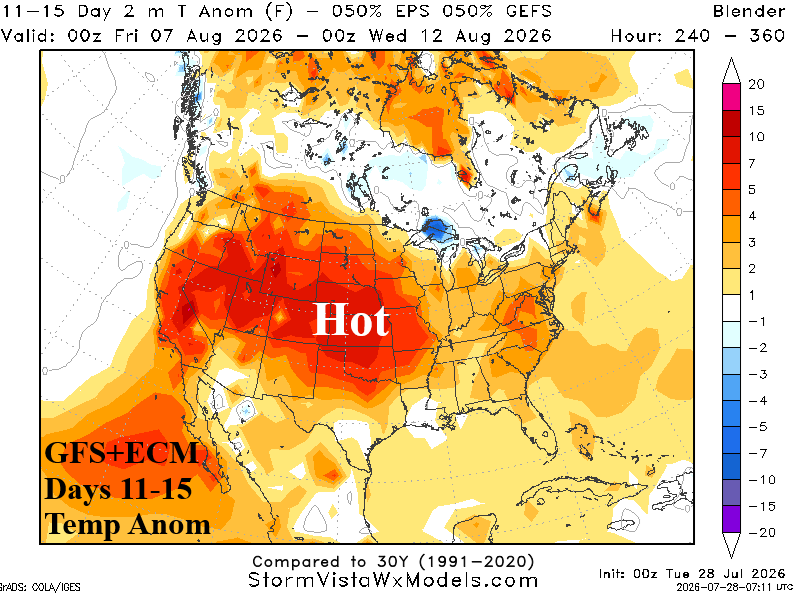
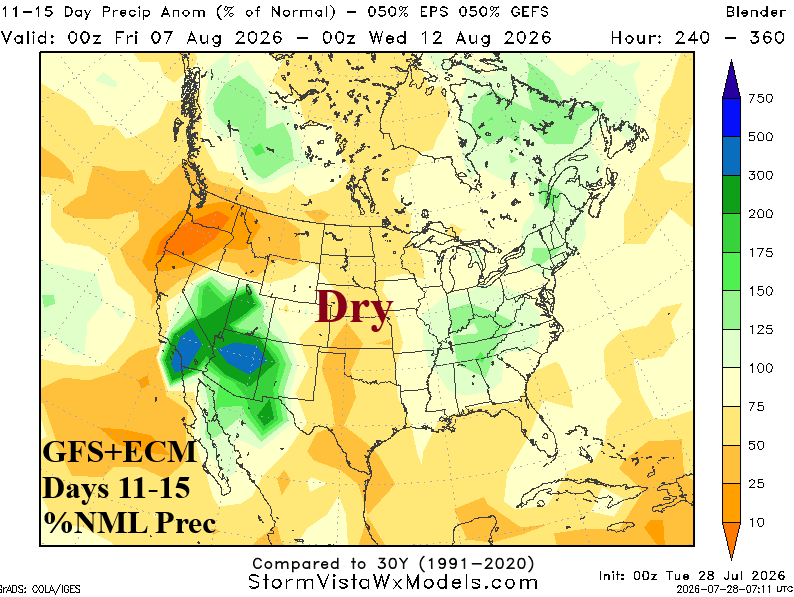
Fig. 7-8: Equally combining GFS and ECM to produce the U.S. 11-15-day temperature anomaly and percent normal rainfall forecast.
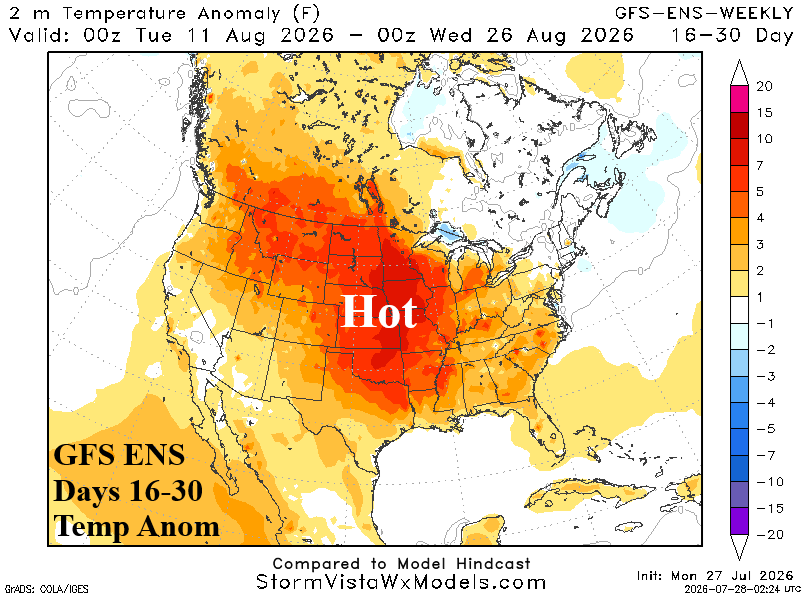
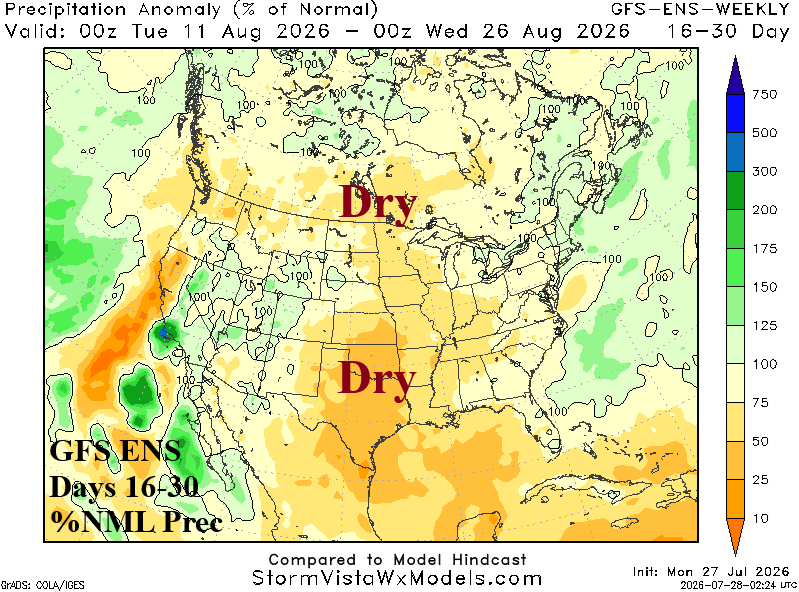
Fig. 9-10: GFS ENS 16-30-day U.S. temperature and precipitation anomalies forecast.