
Ongoing Canada Fires/Dangerous Summer Outlook
05/29/2025, 11:34 am EDT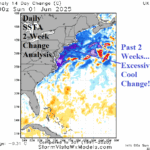
Dramatic Cool Change to Ocean Surface Off Northeast U.S. Coast
06/02/2025, 12:47 pm EDT
Climate Impact Company U.S. 6-Week CDD Scorecard
Headline: Changeable low cooling demand in U.S. shifts much warmer than normal at times in June/early July.
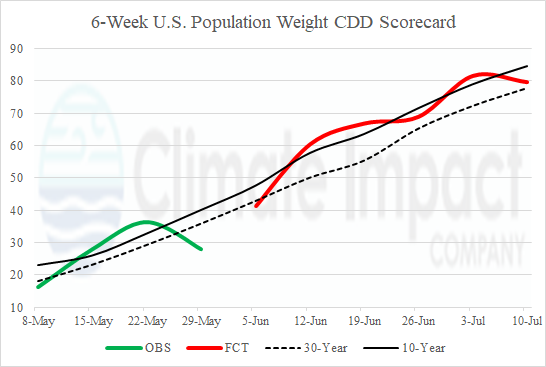
Fig. 1: The warm season U.S. population weight weekly CDD observations (so far) and 6-week forecast.
Discussion: A warmer (or cooler) than normal national climate DOES NOT necessarily equate to U.S. cooling demand. National CDD observations and forecasts are biased hotter or cooler by BOTH the temperature pattern and the population of the areas affected. Usually, anomalous heat in the PJM sector affects high national cooling demand (CDD’s) most effectively. Climate Impact Company initializes the U.S. 6-Week CDD Scorecard today, updated several times each week. The data is provided by CWG/SVWM. Graphs and commentary are provided by Climate Impact Company.
May 2025 featured 2 weeks with above normal national cooling demand and 2 weeks of below normal national heating demand. May CDD’s usually do not have major impact on natural gas prices. However, the May pattern identifies the CDD trend as the warm season begins. The trend identifies a May pattern featuring large swings in weekly CDD’s typical of the shoulder season.
The forecast for the first 3 weeks of June shifts from slightly cooler than normal in early June to some robust warm CDD counts for the 2nd and 3rd week of the month. The latest forecast indicates the (volatile) GFS is the leading contributor to the warmer CDD values. However, all models are generally warmer than the 10-year normal. Operational models are unsure of how much warming across the PJM sector as the middle third of June arrives therefore the warm forecasts are possibly too warm and the forecast confidence for the week of June 6-12 is below average.
The week 4-6 forecast, based on a consensus of CFS V2 and ECM reveals a “hot” spike for the week ending July 3 with close to normal CDD for the week before and after (Fig. 3). The hot spike is driven largely by a possible heatwave scenario across the Chicago-to-NYC and DCA stretch.
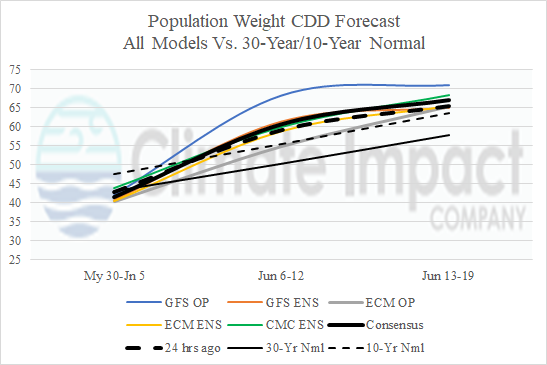
Fig. 2: The U.S. population weight CDD forecast utilizing all models, their consensus, and comparing with 24 hours ago and the 30-year/10-year normal.
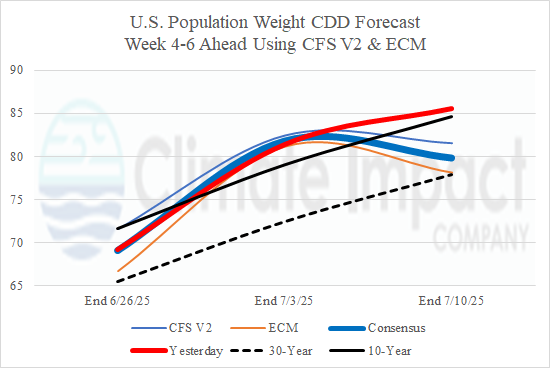
Fig. 3: The U.S. population weight CDD forecast for weeks 4-6 ahead utilizing the CFS V2 and ECM (models).