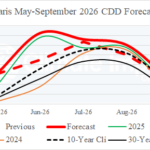
The Heathrow/Paris Vs. Berlin CDD Forecast Divide!
06/07/2026, 9:42 am EDT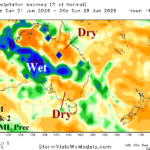
Persistent Positive Phase Southern Annular Mode Causes Australia Wet Weather, Delays Drier El Nino Effect
06/14/2026, 9:44 am EDT

Climate Impact Company Daily Feature
Issued: Wednesday, June 10, 2026
Highlight: 2nd warmest spring on record, trailing only 2012.
Discussion: The second warmest meteorological spring on record was observed during MAR/APR/MAY 2026 (Fig. 1). The warmest on record was observed in 2012, the year of a prohibitive drought. All-time record-warmth was observed in Arizona, New Mexico, Colorado, and Texas for meteorological spring. The remainder of the contiguous U.S. was MUCH ABOVE normal except marginally ABOVE normal for the Upper Midwest to New England States.
Climate Impact Company attributes the record warmth to semi-permanent high-pressure ridging over the Southwest U.S. northwest of a record-strength marine heatwave off the Southwest Coast of North America.
The high pressure was causal to a drier than normal climate, ranking 37th driest on record (Fig. 2). The Mid-Atlantic, Southwest, and North-central U.S. ranked MUCH BELOW normal precipitation. The clash between the Southwest U.S. upper-level high-pressure ridge and Canadian Polar Vortex created an energetic storm track across the Great Lakes region. Michigan observed their wettest meteorological spring on record.
In May, the national warmer than normal regime eased ranking 28th warmest on record (Fig. 3). The Northwest U.S. and Florida ranked MUCH ABOVE normal for May. Ohio, West Virginia, and Pennsylvania were cooler than normal.
The late meteorological spring 2026 precipitation pattern was wetter than normal in the Gulf States and drier than normal across the northern tier of the U.S. (Fig. 4). After a super wet early-to-middle spring, May was very dry in the Great Lakes region/Upper Midwest.
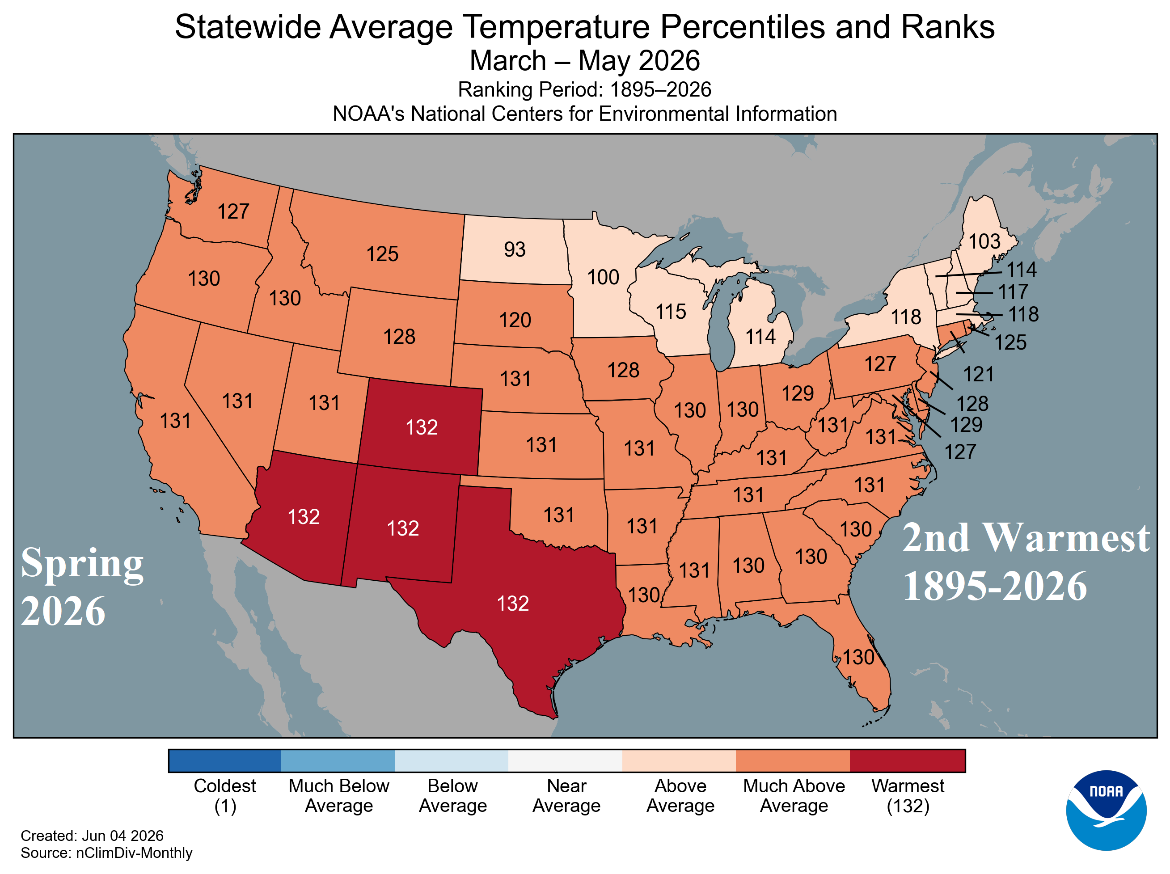
Fig. 1: NOAA state rankings for temperature based on 1895-2026 climatology during MAR/APR/MAY 2026.
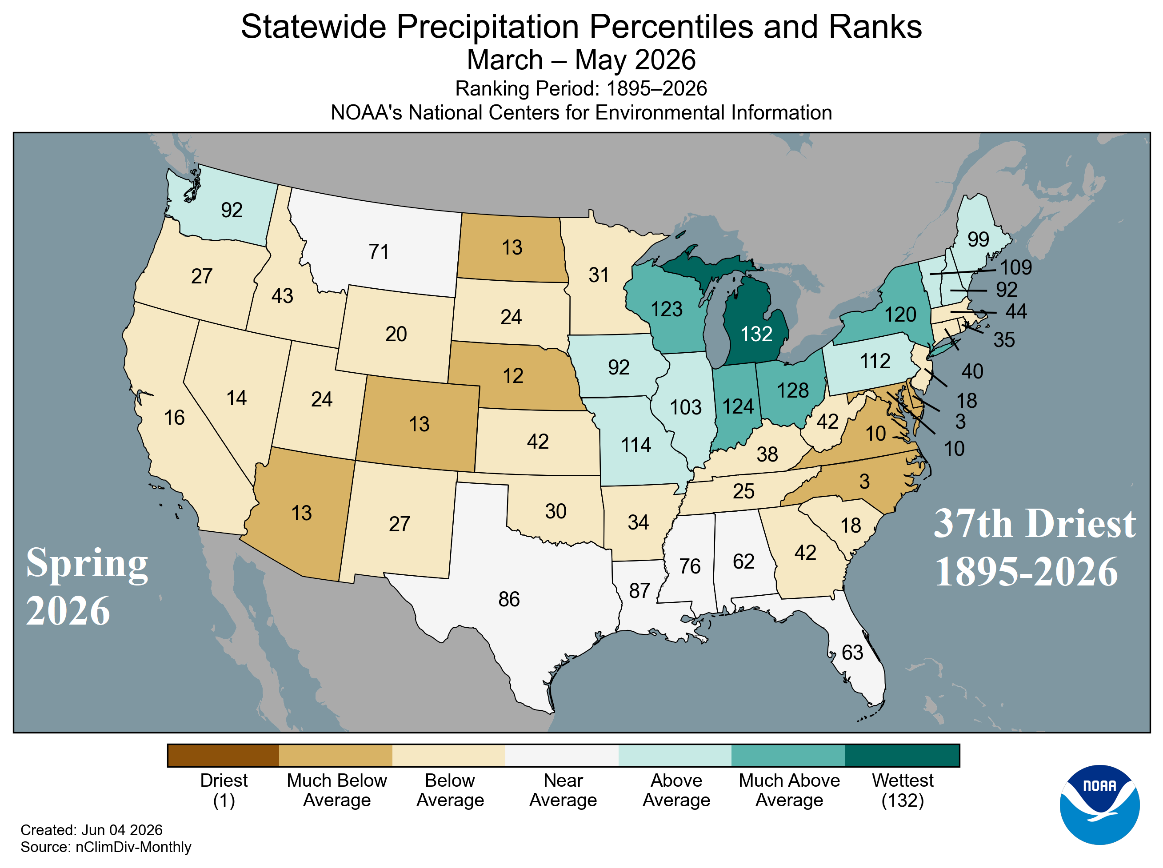
Fig. 2: NOAA state rankings for precipitation based on 1895-2026 climatology during MAR/APR/MAY 2026.
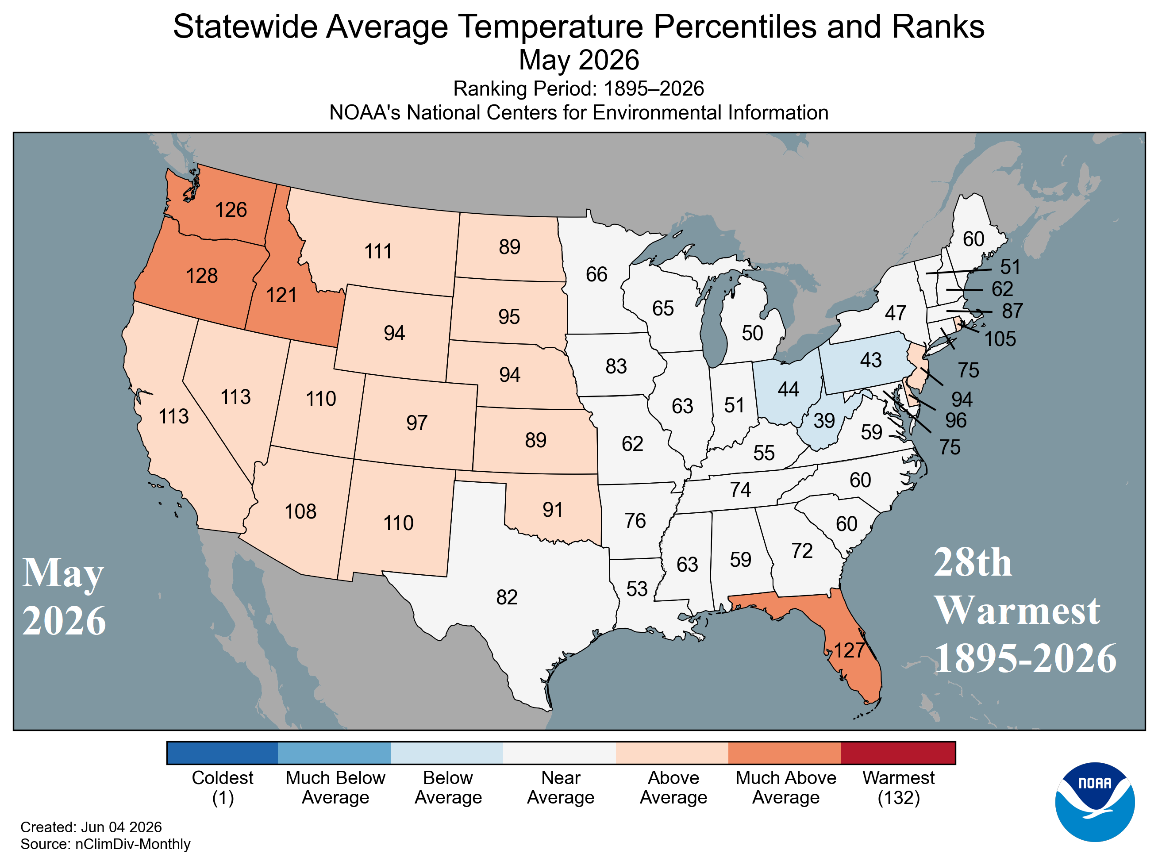
Fig. 3: NOAA state rankings for temperature based on 1895-2026 climatology during May 2026.
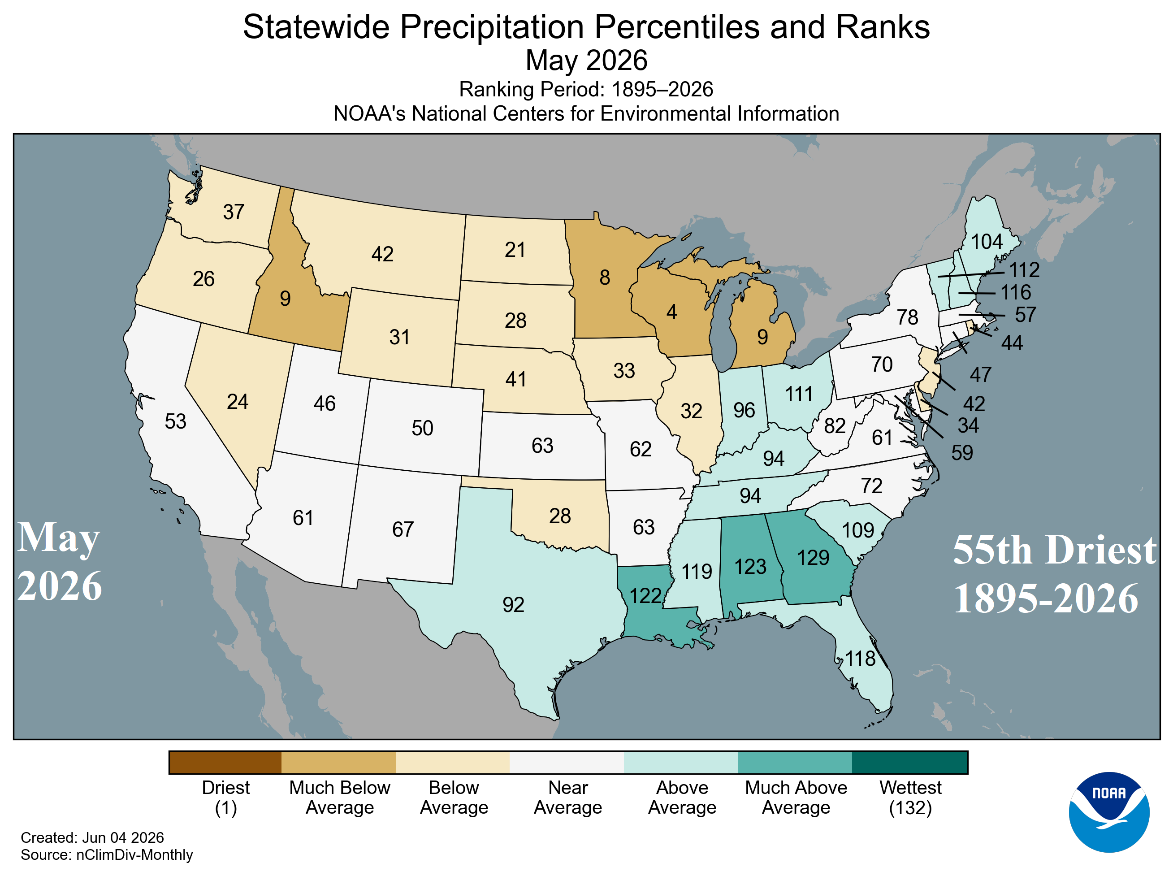
Fig. 4: NOAA state rankings for precipitation based on 1895-2026 climatology during May 2026.
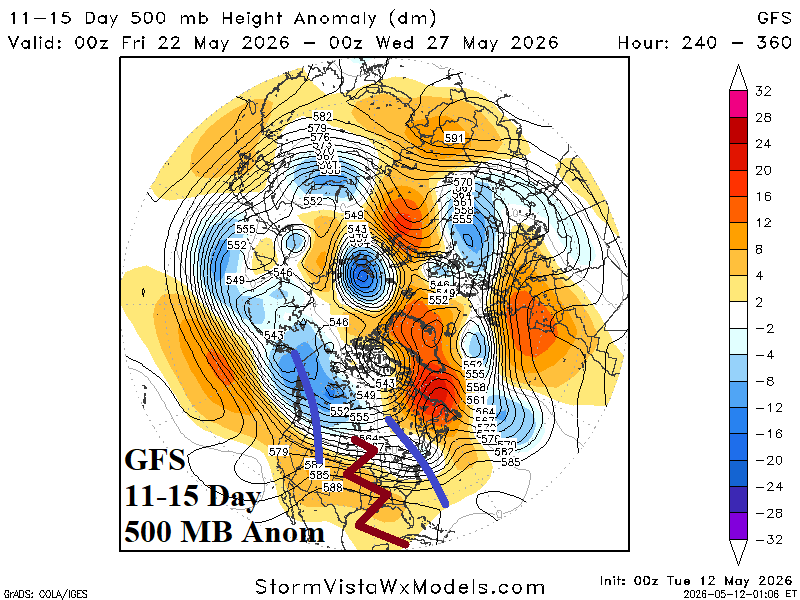
Fig. 4: The 00Z GFS 11-15-day northern hemisphere 500 MB anomaly forecast.