
Potential -AO/-NAO Ahead; Operational Models Confused on That Potential
10/11/2026, 9:41 am EDT
Central/Northern Brazil Drought Concerns; Most Major Crop Areas Not Affected
10/16/2026, 4:46 am EDT
Climate Impact Company Early U.S. Report
Issued: Monday October 12, 2026
Highlight: -NAO ahead, but effects muted.
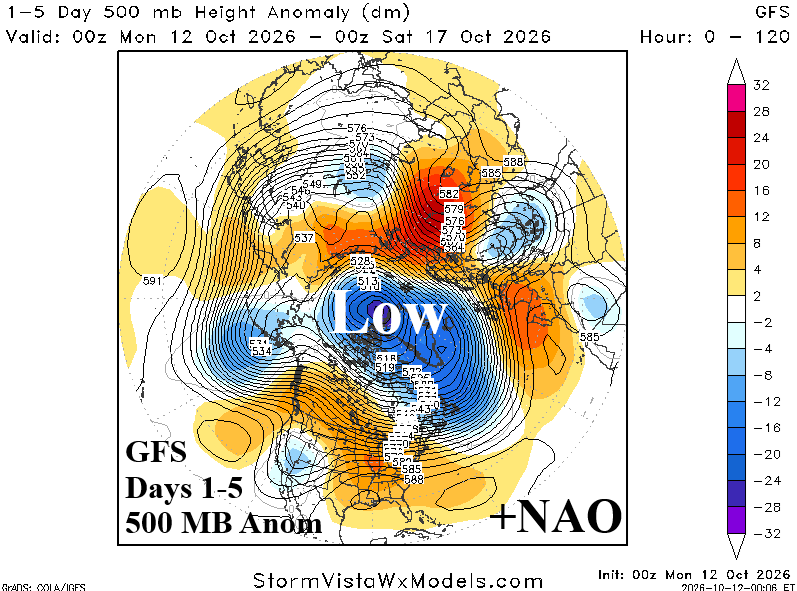
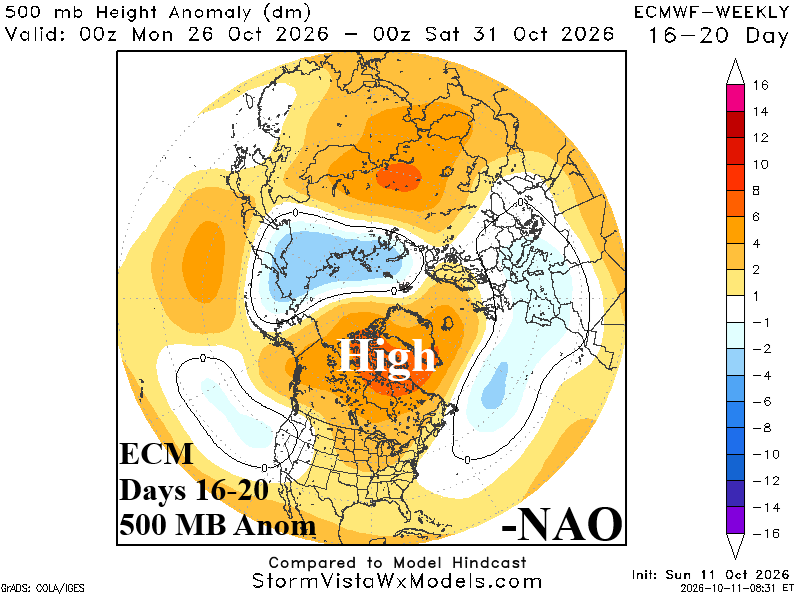
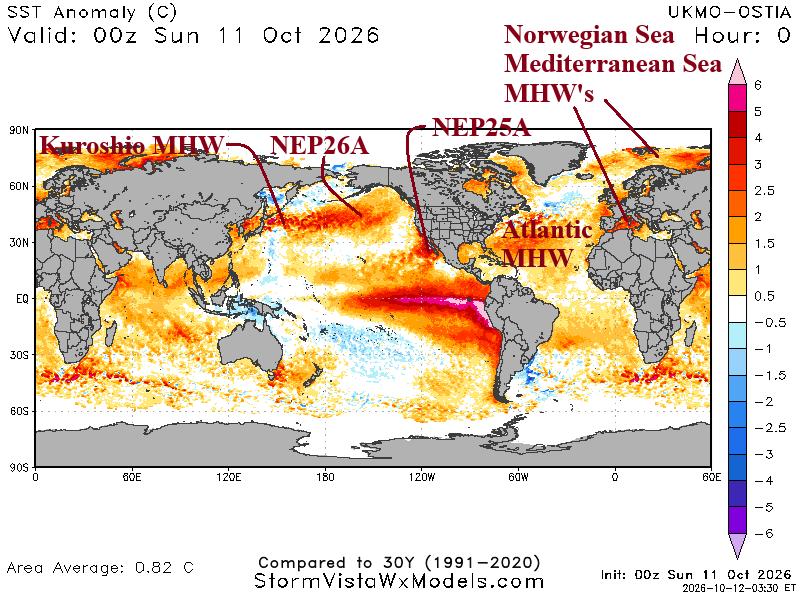
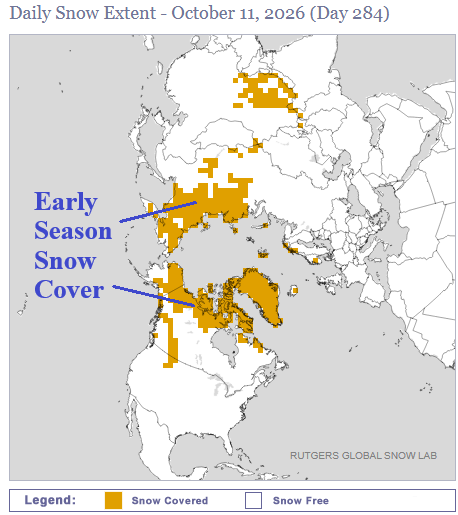
Fig. 1-4: The 1-5-day and 16-20-day 500 MB anomaly forecast for the northern hemisphere identifying the +NAO to -NAO shift. However, nowadays, -NAO historical ability to generate mid-latitude chill is muted by warm SST. Also indicated, early season northern hemisphere snow cover.
Discussion: The ongoing campaign by Climate Impact Company to identify how mid-latitude oceanic warming affects historical understanding of climate signals continues. The most recent example is the +NAO to -NAO pattern change projection over the next 2-3 weeks. Note the +NAO signature now with a fortified polar vortex in the polar region (Fig. 1) gradually fading with a high latitude high pressure area evolving by the 16-20-day period (Fig. 2). Certainly not a classic -NAO pattern, however, in the mid-latitudes low pressure troughs normally caused by -NAO regimes are confined to Northern Russia and (weakly) in Europe (Fig. 3). The U.S. does not cool off due to -NAO. The enhanced upper trough in Northern Russia is due to early season snow cover (Fig. 4). Once again, now that the cold season is approaching, SSTA patterns, outside of the tropical regimes (and snow cover), modify climate signals influences on mid-latitude weather regimes.
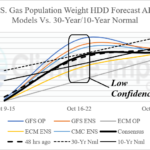
The U.S. population weight HDD forecast is interesting identifying the lack of significant cooling effect by an evolving -NAO late this month (Fig. 5). However, the week 3-5 outlook extending well into November is sharply colder compared to the Friday forecast. Why? The Forecast is generated by analogs, not necessarily the temperature anomaly forecasts observed in “weeklies” graphics. The analogs anticipate -NAO and use historical (-NAO) patterns to make the forecast which are much cooler than the modern-day correlations (Fig. 6).
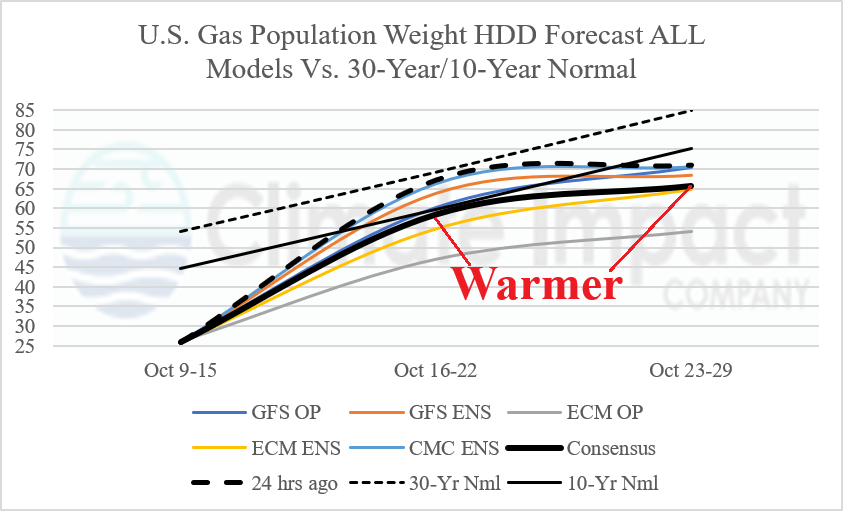
Fig. 5: Collection of operational models and their U.S. population weight HDD forecasts through late October identify warmer changes since yesterday.
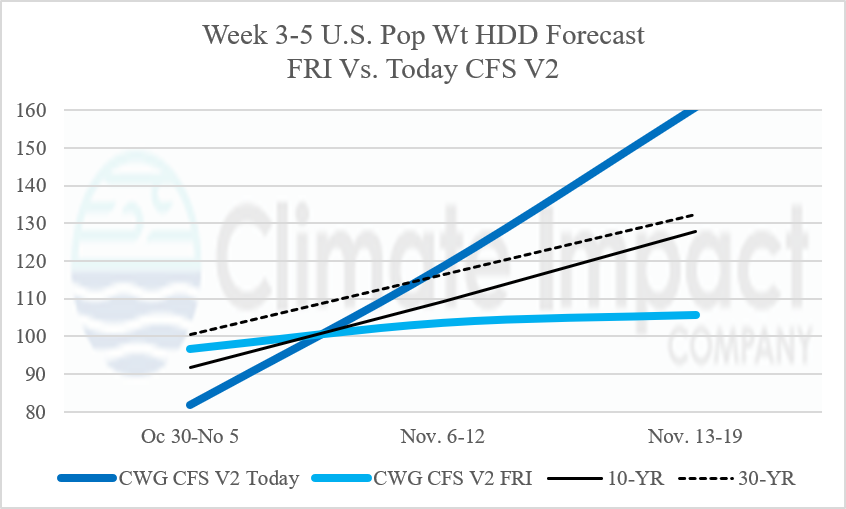
Fig. 6: The CWG/SVWM week 3-5 U.S. population weight HDD forecast using the CFS V2 model is MUCH COLDER for November.