
South America Rainfall Report
10/09/2026, 9:09 am EDT

Climate Impact Company U.S. Sunday Report
Issued: Sunday, October 11, 2026
Highlight: Is the arctic oscillation/North Atlantic oscillation doing a nosedive to negative phase in 2 weeks? Ongoing heavy rains related to weakened TC’s.
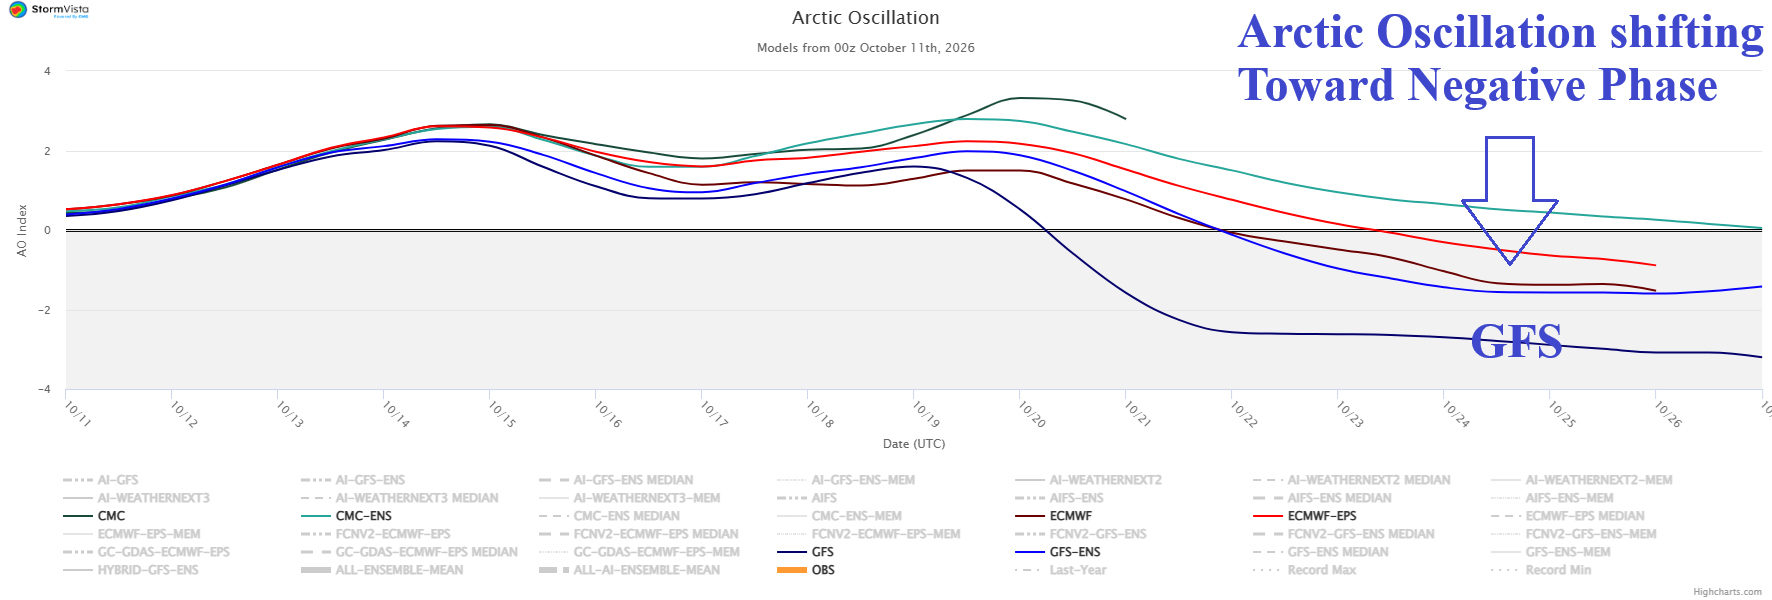
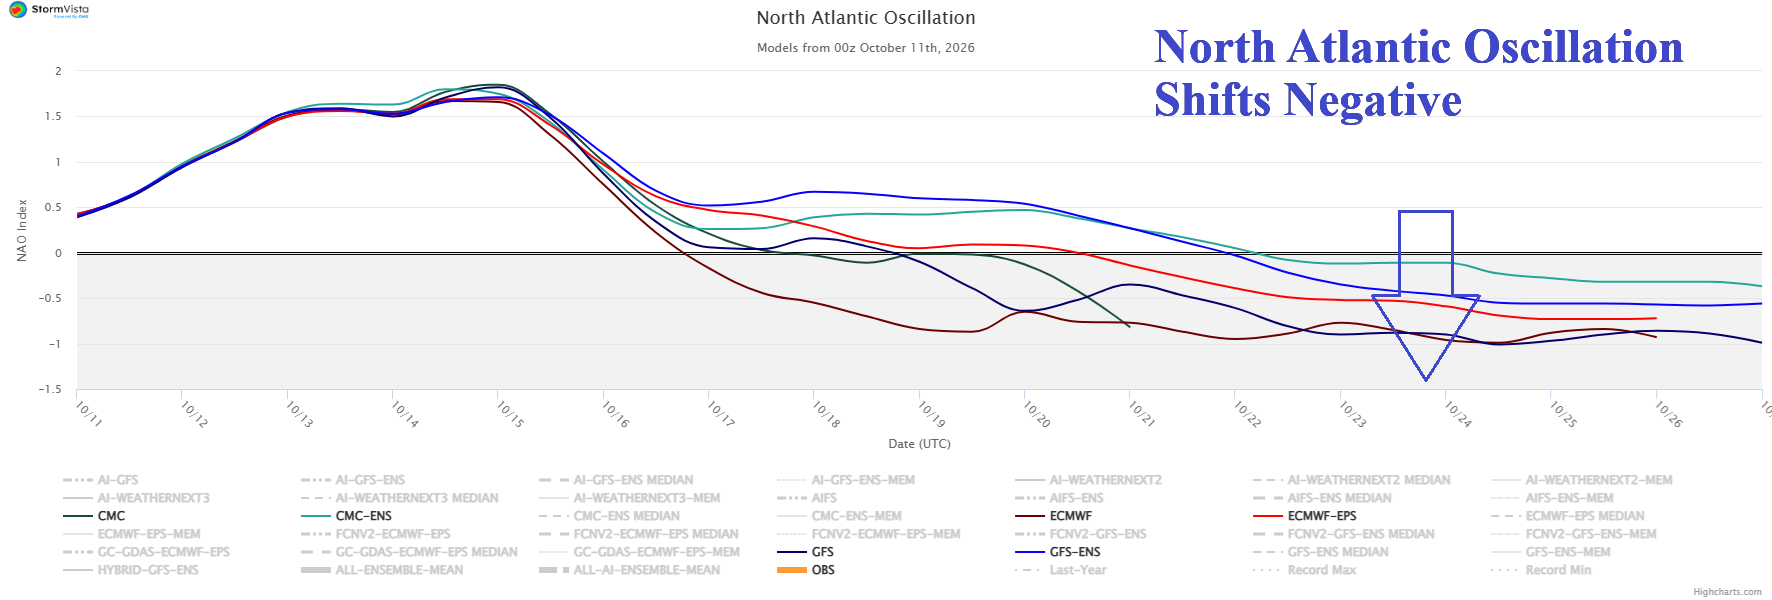
Fig. 1-2: Forecast models indicate a clear trend toward negative phase of the arctic oscillation/North Atlantic oscillation in the 8-14/11-15-day period.
Discussion: The answer to that question is “increasingly likely”. Certainly, not all models agree. However, the trend of all models is out of the positive phase and toward the negative phase while GFS whole-heartedly projects a stronger -AO/-NAO pattern (Fig. 1-2).
The first diagnostic to review which supports the -AO/-NAO evolution (now that the NOV-MAR cold season is approaching) is whether any stratospheric warming appears in the polar region. In the 11-15-day period, most models reveal stratospheric warming over Canada while the Eurasia stratosphere is cold (Fig. 3-4). The mixed results identify why climate signals are trending toward negative, but except for GFS, do not complete the full transition. However, the weekend trend IMPLIES -AO/-NAO may be present during the 16-20-day period supporting cooler forecasts.
Many tropical cyclones (Pacific) or subtropical storms (Atlantic) roll poleward during the next 15 days increasing the effectiveness of latent heat release into an increasingly colder polar atmosphere to cause a pattern change. In summary, tropical forcing could favor some warming of the stratosphere on the North America side of the polar region causing trough patterns to form in the troposphere, inspiring cooler weather. Forecast confidence at day-15 ranges from 58% (GFS ENS) to 39% (ECM ENS) regarding a 500 MB trough causing a cooler pattern change for the East U.S. (Fig. 5-6).
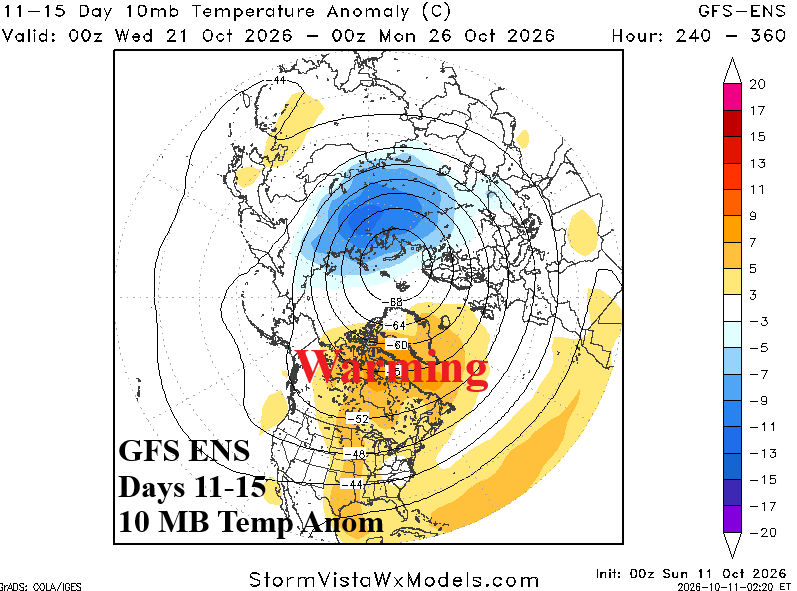
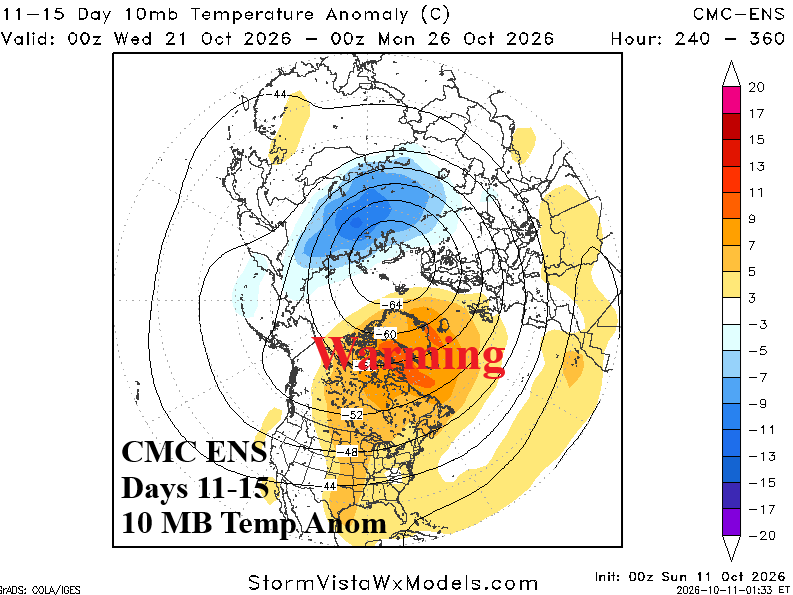
Fig. 3-4: Forecast models indicate a clear trend toward negative phase of the arctic oscillation/North Atlantic oscillation in the 8-14/11-15-day period.
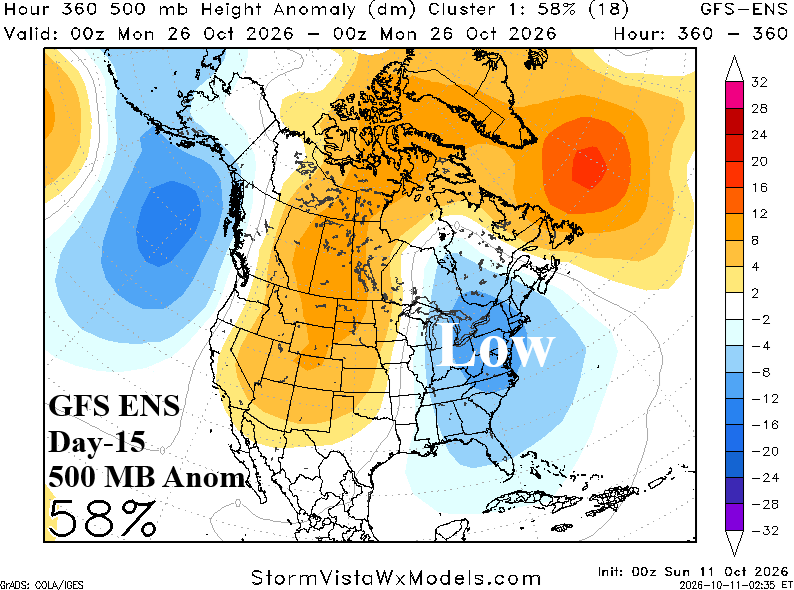
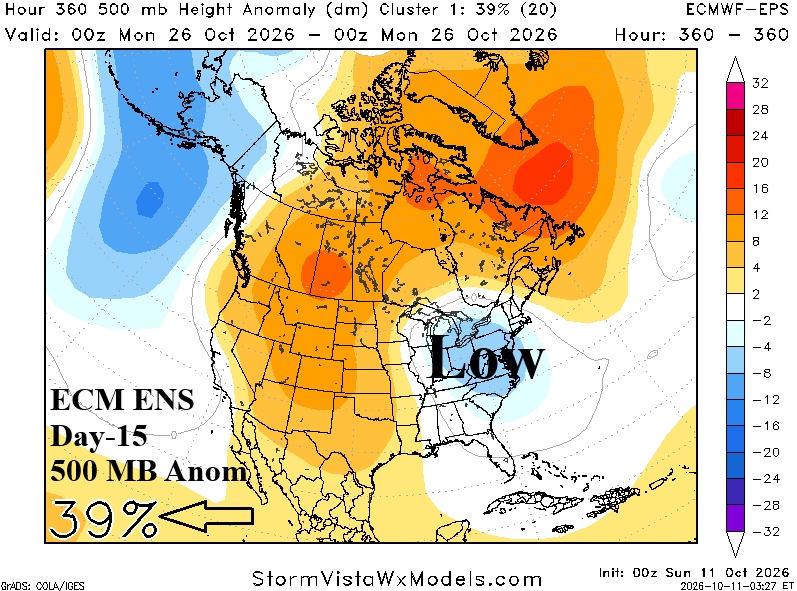
Fig. 5-6: Mega-cluster ensemble GFS ENS and ECM ENS “most likely” 500 MB anomaly pattern for North America in 15 days.
Right now, most operational models do not reflect their climate signals forecasts which is why traders/analysts are encouraged to watch trends rather than any single forecast. Many forecast models are cool East days 6-10 followed by an 11-15-day warm-up with the warmth extending to the 16-20-day period. The AO/NAO forecast (above), if consistent through tonight, suggests a cooler East U.S. extended range. To illustrate the low confidence forecast, note U.S. gas population weight HDD projections for Oct. 16-22 which depict one of the largest ranges in possibilities seen (Fig. 7).
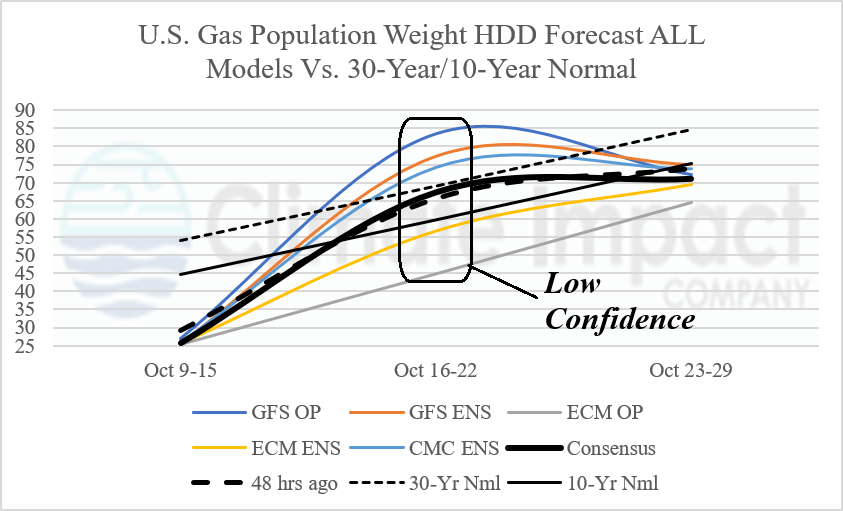
Fig. 7: U.S. gas population weight HDD forecast through late October.
NOAA/WPC quantitative precipitation forecasts indicate excessive rain/flood risk for the Interior West and Mid-Atlantic States today (Fig. 8) both events related to remnants of tropical cyclones (Rachel and Isaias). The ongoing flood risk remains anchored over the Interior West tomorrow (Fig. 9). The Interior West storm reconvenes over the southern Great Plains to Texas midweek (Fig. 10-11).
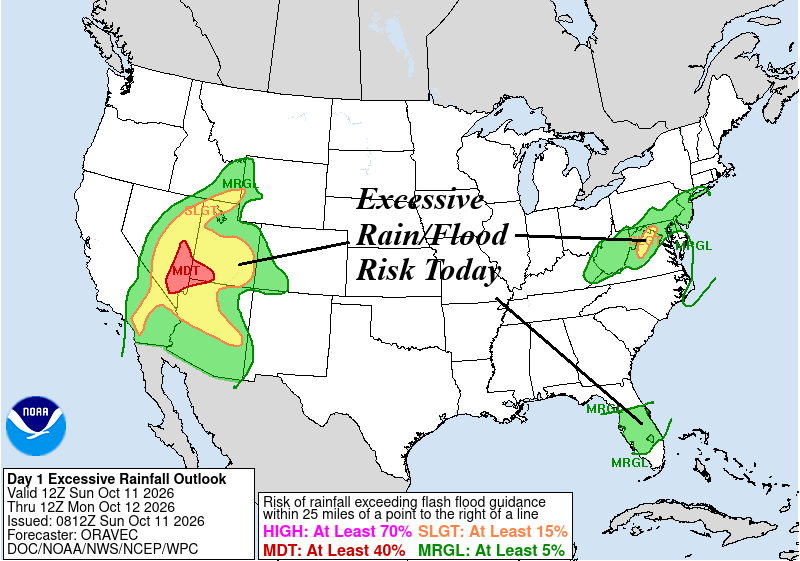
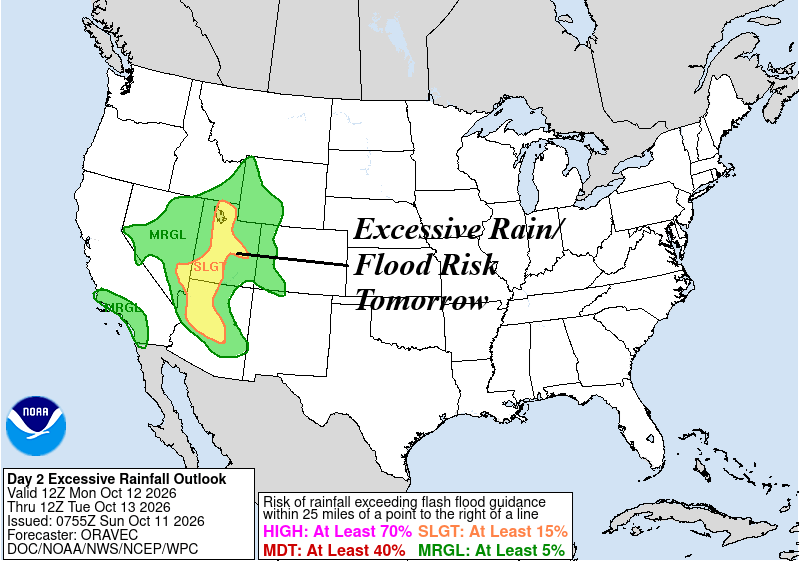
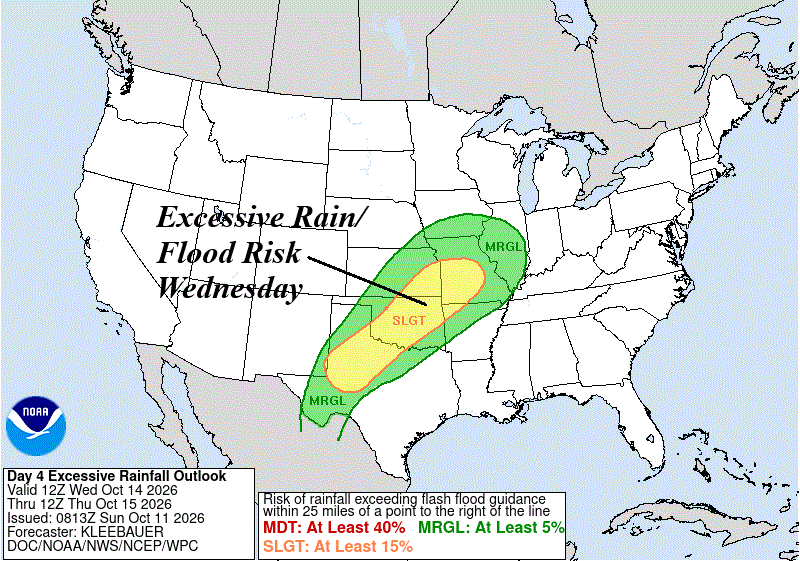
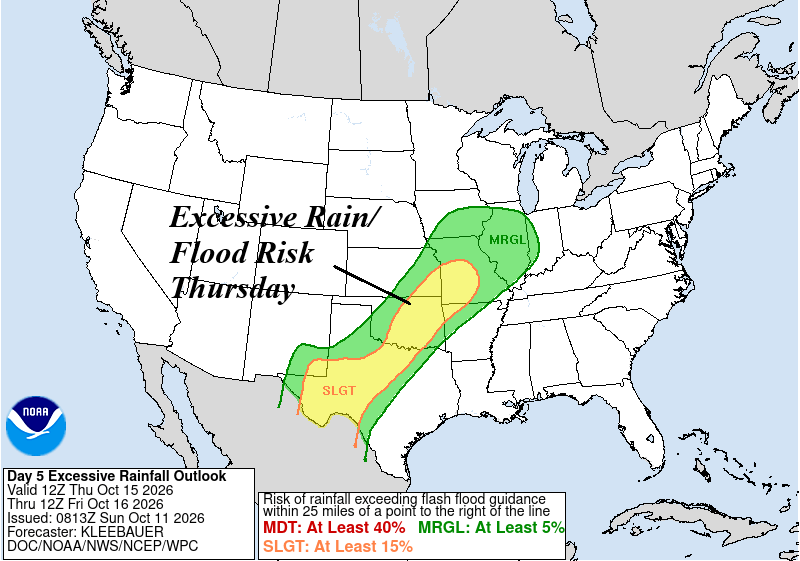
Fig. 8-11: NOAA/WPC quantitative precipitation forecasts for this week in the U.S.