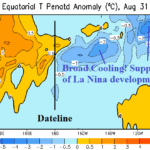
Subsurface East Equatorial Pacific Ha Notably Cooled Fueling La Nina Risk
09/09/2025, 5:02 am EDT
92L Likely to Develop, Stay Out-to-Sea; Comments on the 2013 TC Season (and Following Winter)
09/15/2025, 11:41 am EDT
Climate Impact Company Early U.S. Notes
Issued: Thursday September 11, 2025
Highlight: Dry forecast in the East/South shifts drier.
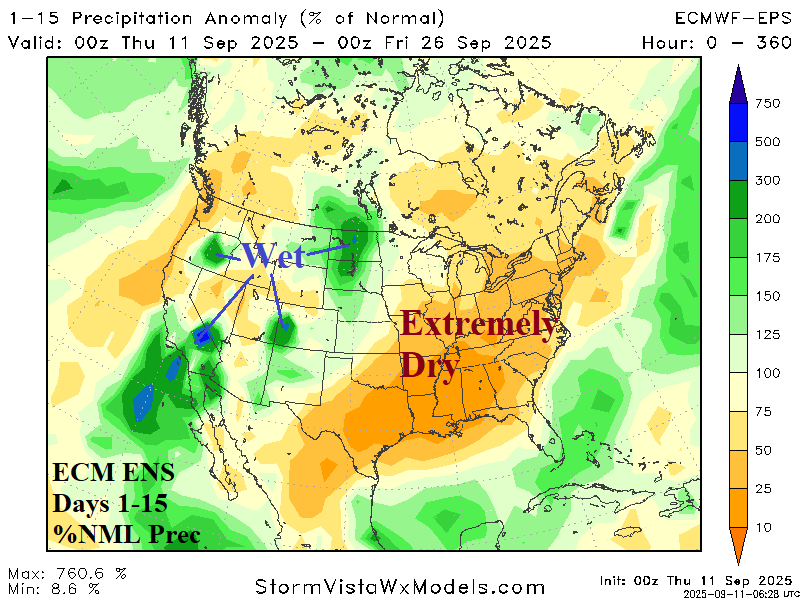
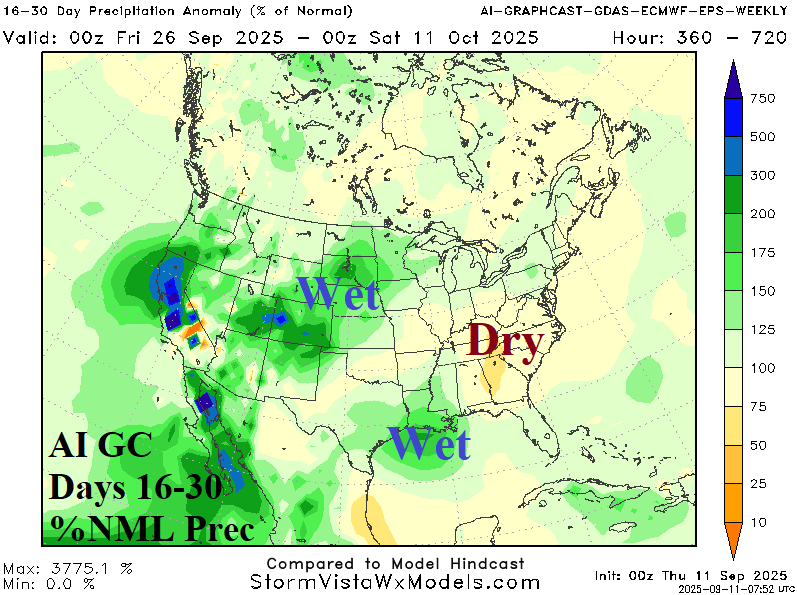
Fig. 1-2: ECM ENS 15-day and AI GC 16-30-day percent of normal precipitation forecast for the U.S.
Discussion: The remarkably dry weather pattern across the South and East U.S. shifts stronger in the overnight ECM ENS 15-day forecast (Fig. 1). Patchy wet monsoon moisture is confined to the western half of the U.S. In the 16-30-day period, the best fit forecast is the AI Graph Cast ECM ENS which reveals increasing wet risk across the U.S. although the East remains mostly drier than normal (Fig. 2).
The Central U.S. is hot despite the approaching arrival of calendar autumn. The NOAA 7-day excessive heat risk forecast peaks on Saturday, most notably in Iowa and Missouri (Fig. 3). Early next week, the late season heat risk continues centered on the Mid-south States and into the Southeast (Fig. 4). The anomalous heat accelerates the drying effect of the dry pattern to worsen soil moisture conditions.
The U.S. population weight CDD forecast maintains the very warm pattern for next week and the following week (Fig. 5). Next week’s forecast edges warmer than yesterday’s outlook.


Fig. 3-4: NOAA excessive heat stress risk forecast for Saturday and Monday.
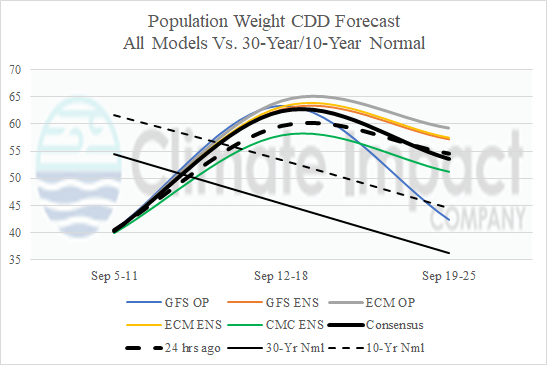
Fig. 5: The U.S. population weight CDD forecast utilizing all models through later September.