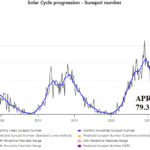
Decelerating Solar Intensity
05/12/2026, 9:34 am EDT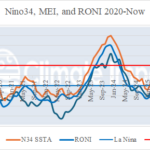
The Springtime ENSO Prediction Barrier LINGERS!
05/14/2026, 4:58 am EDT
Climate Impact Company Early U.S. Notes
Issued: Wednesday May 13, 2026
Highlight: El Nino onset, U.S. pattern change.
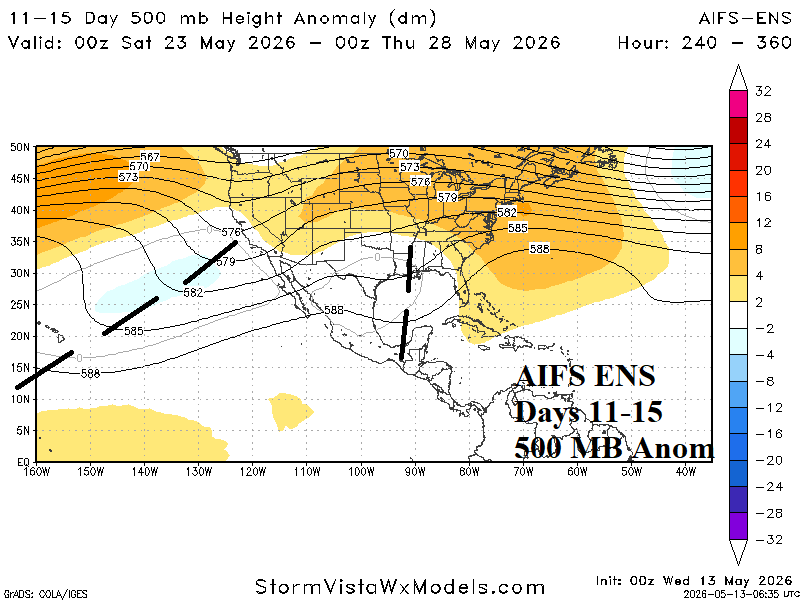
Fig. 1: The AIFS ENS 11-15-day 500 MB anomaly forecast indicates two significant upper troughs in the subtropics.
Discussion: The daily Nino34 SSTA is +1.12C, warming nearly 1C during the past 4 weeks, and El Nino onset is here! Along with the significant warming of the tropical East Pacific are ongoing flourishing marine heatwaves off the Southwest Coast of North America and stretching from the Gulf of Mexico eastward of the Bahamas. The ocean warming plays a significant role in a weather pattern change ahead!
The 11-15-day AIFS ENS projects two potent upper troughs across the buoyant warm SSTA patterns (Fig. 1). Entraining abundant low-level atmosphere moisture inspired by the super-warm SSTA pattern inspires widespread southern latitude heavy rains southwest of Baja California and in the Gulf of Mexico (and vicinity) in response to the AIFS ENS upper air forecast (Fig. 2). The daily SSTA analysis clearly identifies the intense marine heatwaves (MHW), notice the rapid warming in the equatorial East Pacific as El Nino arrives (Fig. 3). As the convective rains become established in the southern latitudes, latent heat release poleward warms the mid-latitude middle atmosphere enabling a large high-pressure ridge entering the 16-20-day period (Fig. 4).
The U.S. population weight CDD forecast reveals a warm-to-hot spike next week (Fig. 5). Temperatures in the Mid-Atlantic States are revised hotter with near 95F likely in Virginia early-to-middle next week. Wetter weather causes a decline in CDD for the week of May 22-28.
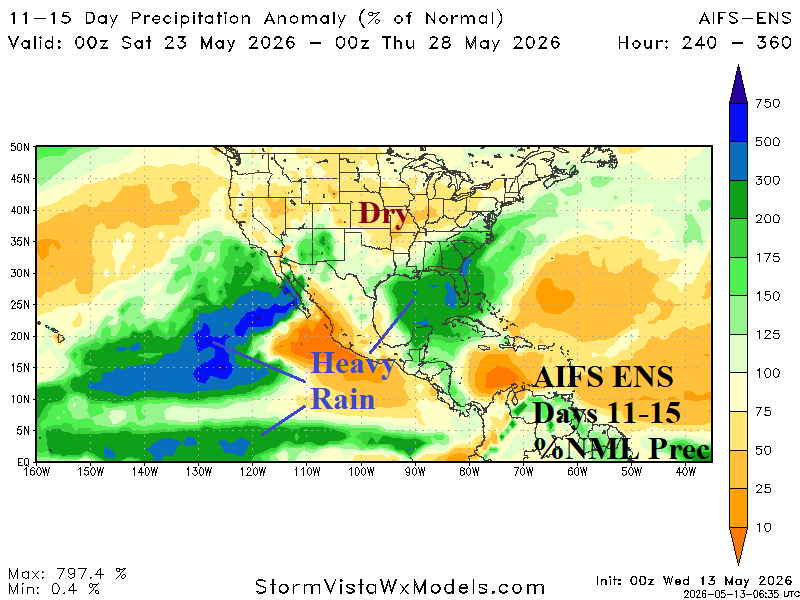
Fig. 2: The AIFS ENS 11-15-day percent of normal rainfall forecast indicates heavy rain areas associated with the upper troughs and the El Nino warm waters in the deep tropics.
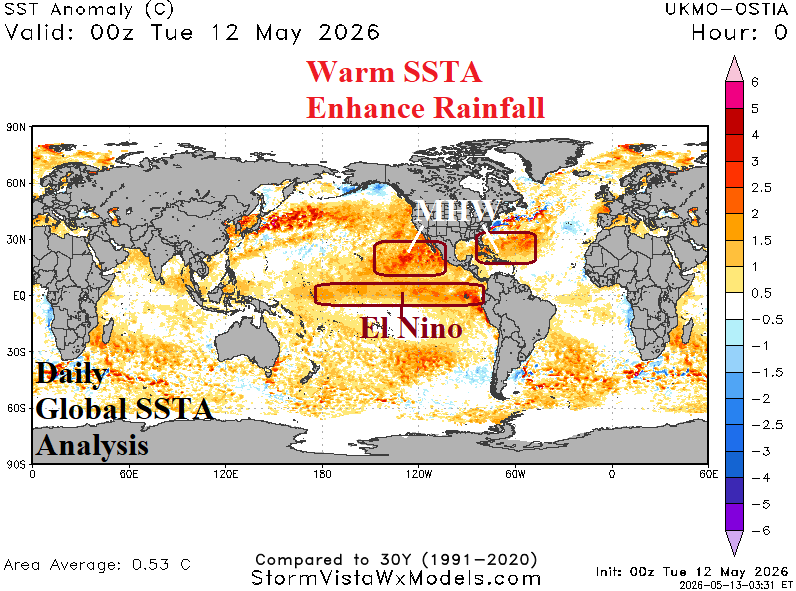
Fig. 3: The wet weather forecasts are enhanced by the above normal low-level atmosphere water vapor inspired by warmer than normal ocean areas.
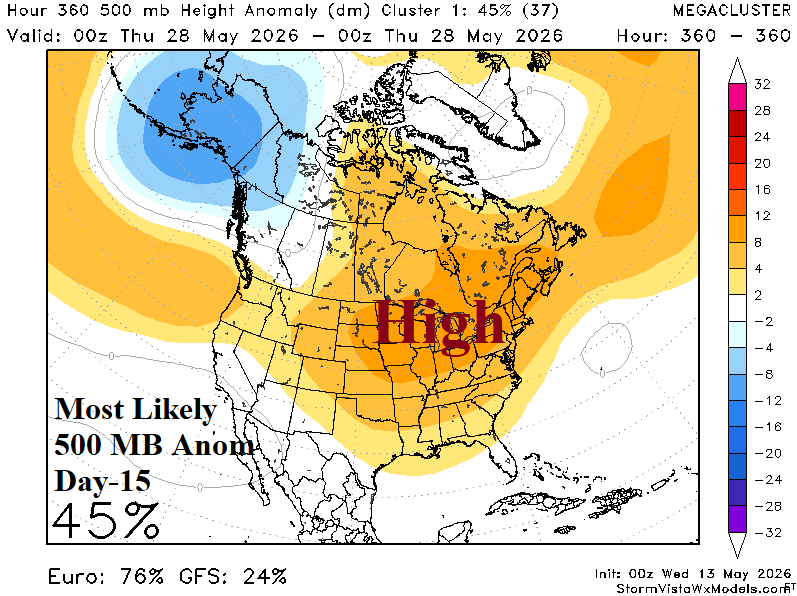
Fig. 4: As the southern latitude wet weather regime organizes, latest heat is released from the attendant convection poleward to warm the mid-latitude atmosphere and project an upper-level high pressure ridge in 15 days.
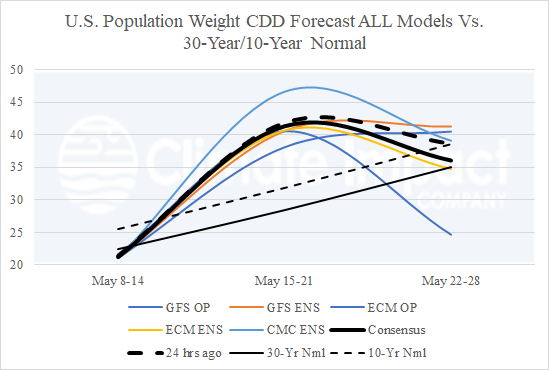
Fig. 5: The U.S. population weight CDD forecast utilizing all models, their consensus, and comparing with yesterday and 30-year/10-year climatology.
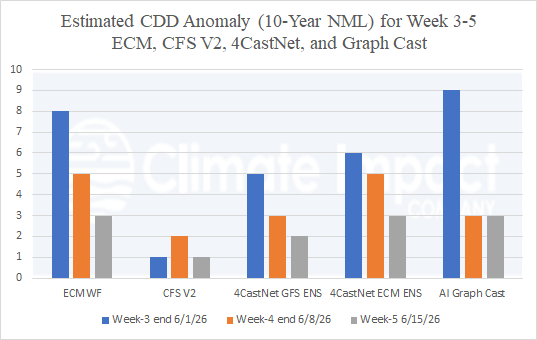
Fig. 6: Estimated CDD anomalies for week 3-5 ahead in the U.S. using ECM, CFS V2, 4CastNet, and Graph Cast.