Southern U.S. Drought Ends if El Nino Forms in 2026
01/30/2026, 5:03 am EST
Did Oceanic Forcing Cause Warmer Pattern-change Across North America?
02/03/2026, 8:22 am EST
Climate Impact Company Gas/Power Report
Issued: Monday February 2, 2026
Using Cleveland and Baltimore HDD’s, 2026 (and 2025) rank coldest since 2014-15. JAN-26 cold similar with last year in Houston.
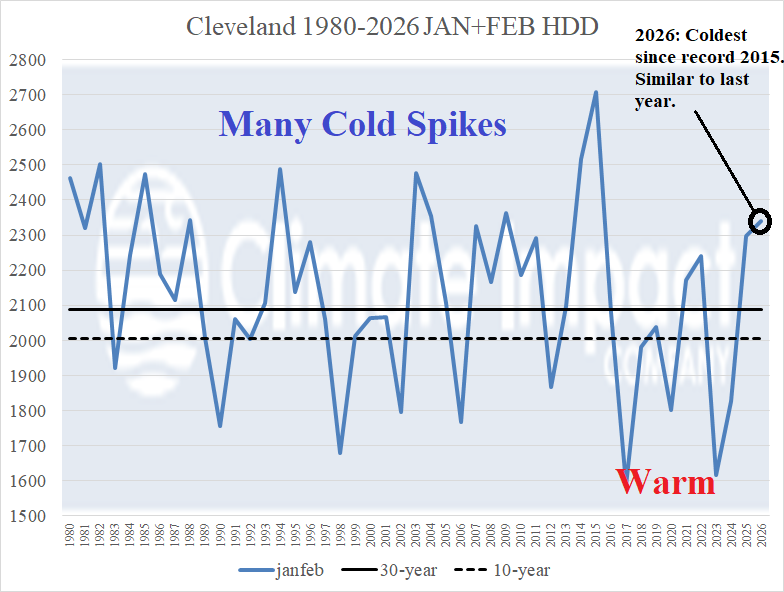
Fig. 1: The JAN/FEB 2026 projected heating degree days compared to the 1980-2025 observations in Cleveland, OH.
Discussion: The observed heating degree days (HDD) in Cleveland during JAN-26 is 1335, much colder than the 30-year (1123) and 10-year (1082) normal. The JAN-26 cold is slightly colder than JAN-25 (1277) and JAN-22 (1273). The JAN-26 observation is 1 HDD colder than the “polar vortex winter” of JAN-14 (1334). Prior to JAN-14, there are 8 colder January’s dating back to 1980. The Climate Impact Company HDD projection for FEB-26 in Cleveland is slightly colder than normal (1004 forecast vs. 30-year normal [966] and 10-year normal [924]). The JAN/FEB 2026 HDD (2339) is the coldest since JAN/FEB 2015 (2709). Since 2015, most JAN/FEB combinations are warmer than normal in Cleveland (Fig. 1). In this decade, either cold or warm extremes have been observed.
In Baltimore, the JAN-26 HDD was 1059 and much colder than the 30-year (930) and 10-year normal (898). Last year was colder (1069) and JAN-25/JAN-26 are the coldest since JAN-14 (1157). JAN-15 observed 1052 HDD. JAN-26 is the 13th coldest (for January) since 1980. The Climate Impact Company HDD projection for FEB-26 is 812 HDD colder than the 30-year (779) and 10-year (728) normal. The JAN/FEB 2026 HDD (1871) is the coldest since JAN-15 (2154) and JAN-14 (2049). Since 2014-15, most JAN/FEB are near to much warmer than normal until the past 2 years (Fig. 2).
In Houston, the JAN-26 cold wave was 8 days long featuring cold peaks of 23 on Jan. 27th and 24 on Jan. 25-26th. The JAN-26 event is very similar in duration and intensity to the JAN-25 cold outbreak (Fig. 3). However, the JAN-26 event was not as intense as Winter Storm “Uri” observed in FEB-21.
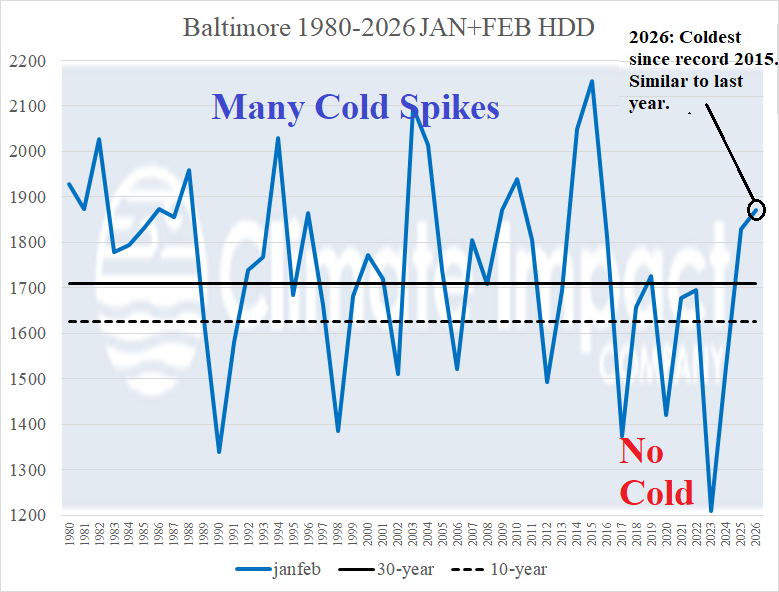
Fig. 2: The JAN/FEB 2026 projected heating degree days compared to the 1980-2025 observations in Baltimore, MD.
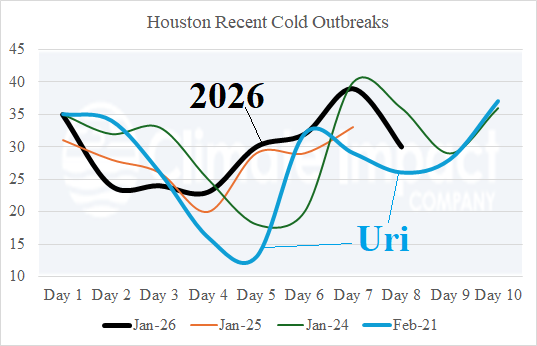
Fig. 3: Number of days and intensity using nighttime low temperature for last 4 cold outbreaks in Houston.