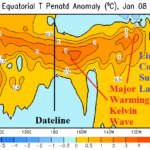
Pacific Kelvin Wave Shifting Eastward and Strengthening
01/12/2026, 9:09 am EST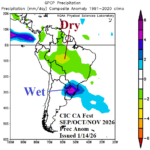
An El Nino South America Climate to Develop in 2026!
01/14/2026, 4:12 am EST![]()
Climate Impact Company Daily Feature
Issued: Tuesday, January 13, 2026
Highlight: Strengthening negative arctic oscillation supports widening cold/arctic air risk for the northern hemisphere last 1/3 of January.
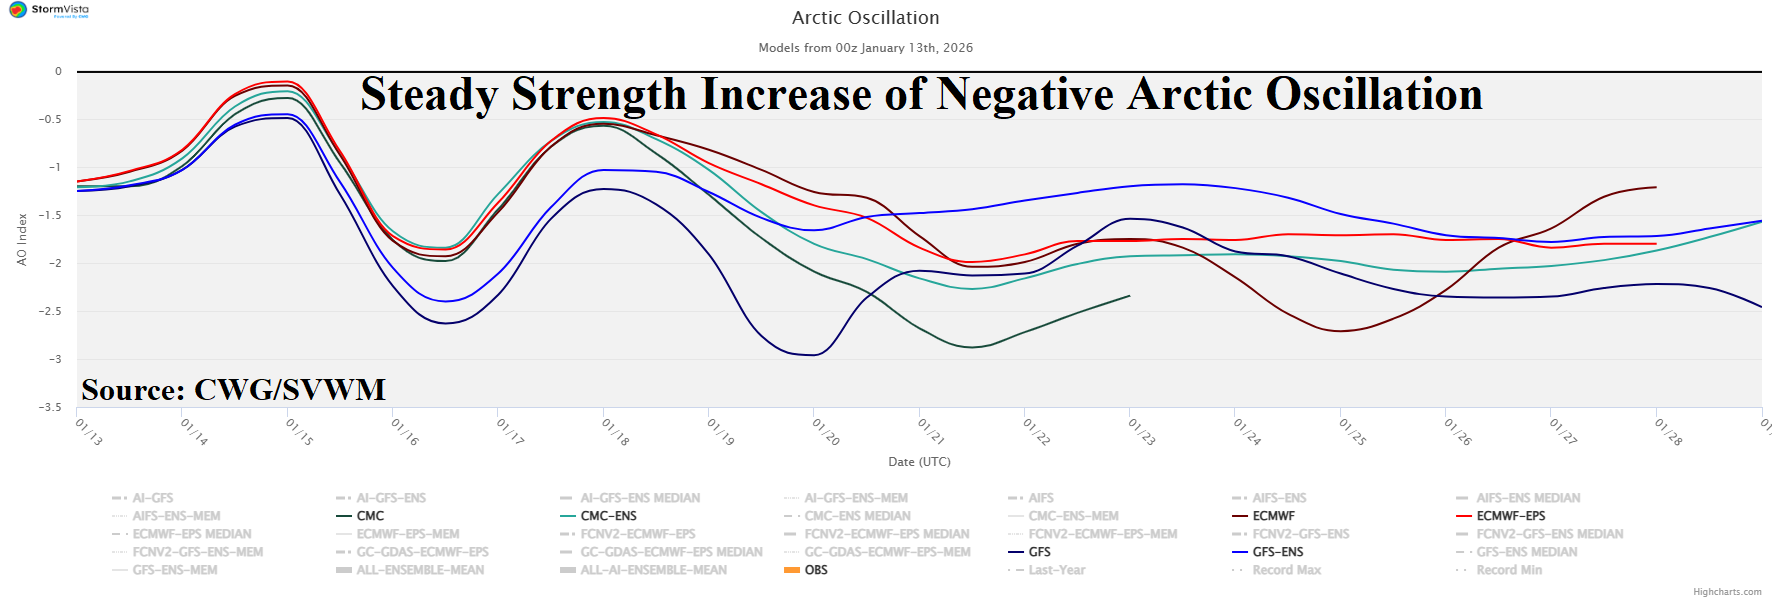
Fig. 1: Utilizing all models, the 15-day arctic oscillation index forecast indicates a strengthening negative phase.
Discussion: Negative arctic oscillation (-AO) has formed. The 15-day outlook strengthens -AO through the remainder of January (Fig. 1). The projected JAN-26 value is near -2.0 rivaled most recently by JAN-21 (-2.4) and JAN-10 (-2.6). Right now, the attendant arctic air mass associated with the -AO pattern stretches across Eurasia (Fig. 2). To compensate, North America is warm. However, -AO will cause trouble. During the 6-10-day period, equally combining GFS and ECM, the 500 MB anomaly outlook projects a “ridge bridge” over Alaska (Fig. 3). The upper ridge causes a cross-polar low-level air mass trajectory taking arctic air from Russia into North America. During the 8-14-day period and especially the 11-15-day timeframe (Fig. 4) a very cold pattern change emerges over North America. The ECM is much colder than the GFS+ECM combination. If the cold emerges as GFS and ECM suggest, the 16-20-day period should feature a cold sprawl into the East as indicated by the AI Graph Cast ECM ENS (Fig. 5). Additionally, the cold sprawl is enhanced by a potential advance in snow cover as indicated day-16 by GFS (Fig. 6). The intensifying -AO forecast indicated by all operational models supports the widening northern hemisphere cold weather risk!
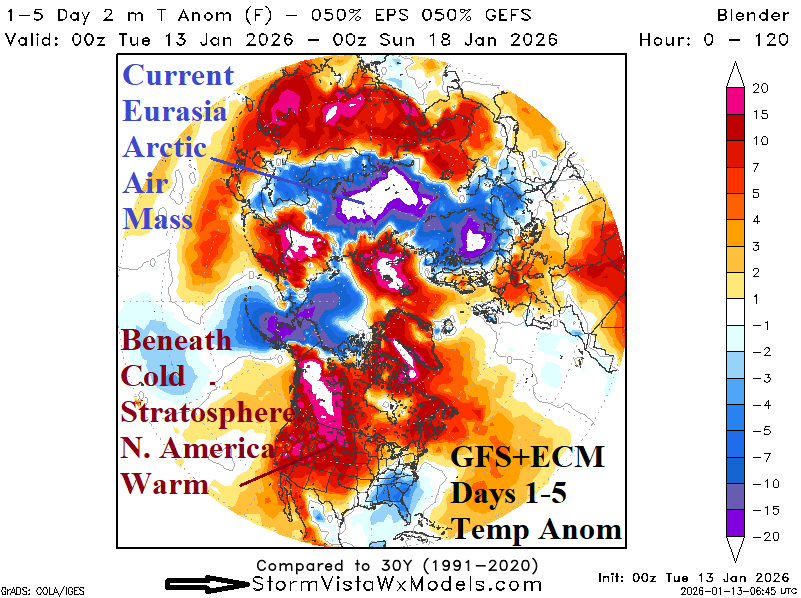
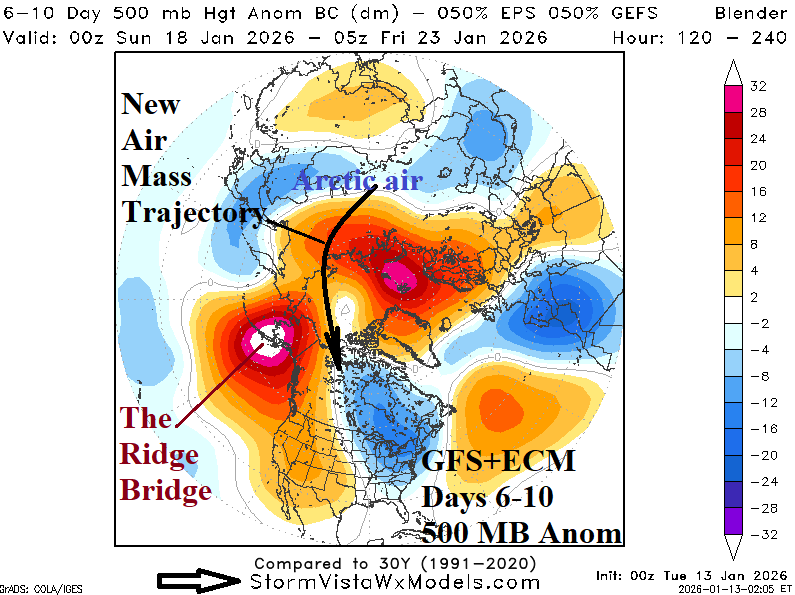
Fig. 2-3: Equally combining GFS and ECM, the 1-5-day temperature anomaly forecast across the northern hemisphere and 6-10-day 500 MB anomaly outlook.
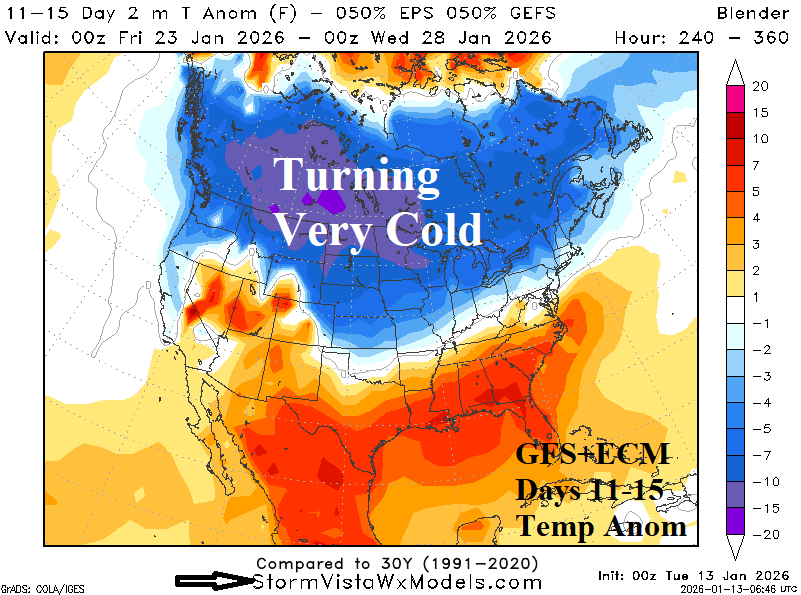
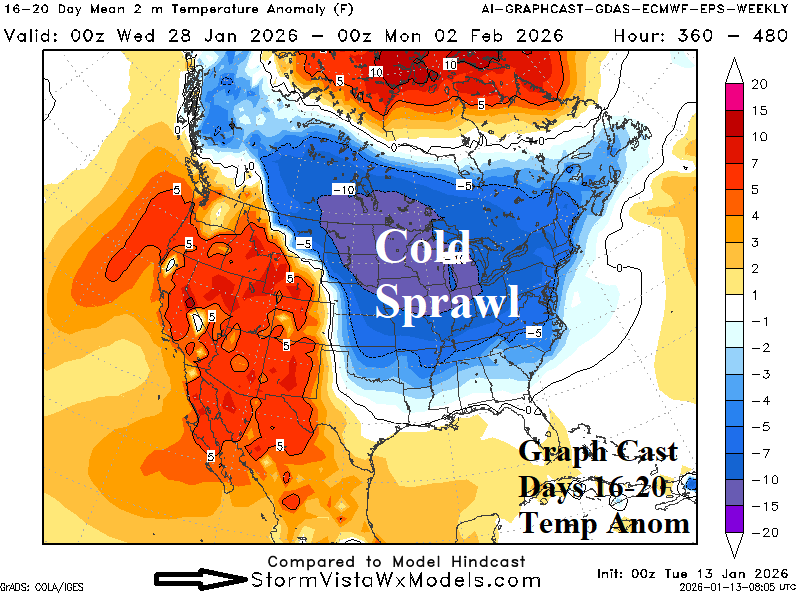
Fig. 4-5: Equally combing the GFS and ECM 11-15-day North America temperature anomaly forecast, and the 16-20-day AI Graph Cast outlook.
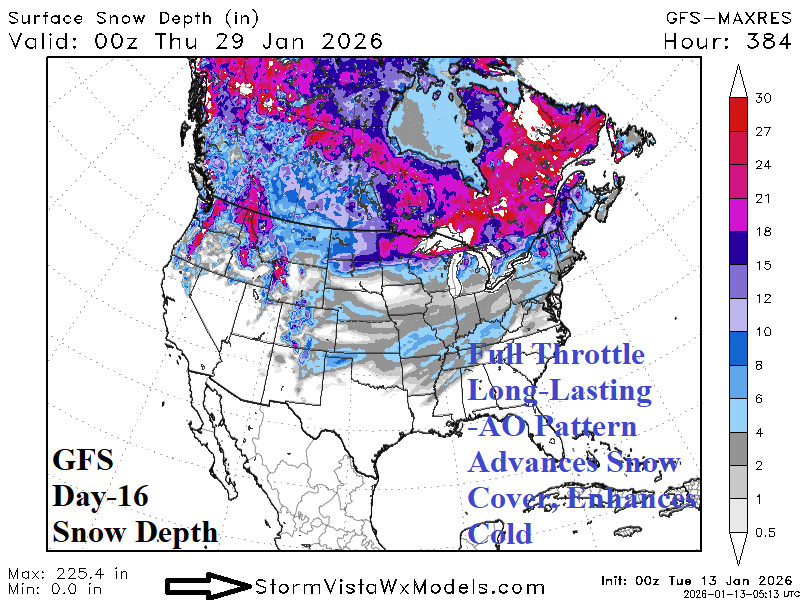
Fig. 6: The potential southern sprawl of U.S. snow cover/snow depth in 16 days driven by -AO pattern according to GFS.