
Tropical Trouble Brewing Days 11-15?
09/10/2026, 5:37 am EDT
Strong to Super El Nino 2026 Continues to Strengthen
09/16/2026, 8:41 am EDT

Climate Impact Company Sunday Agriculture Report
Issued: Sunday, September 13, 2026
Highlight: Latest multivariate ENSO index, early El Nino climate in South America and Australia, and some wet relief for India drought region.
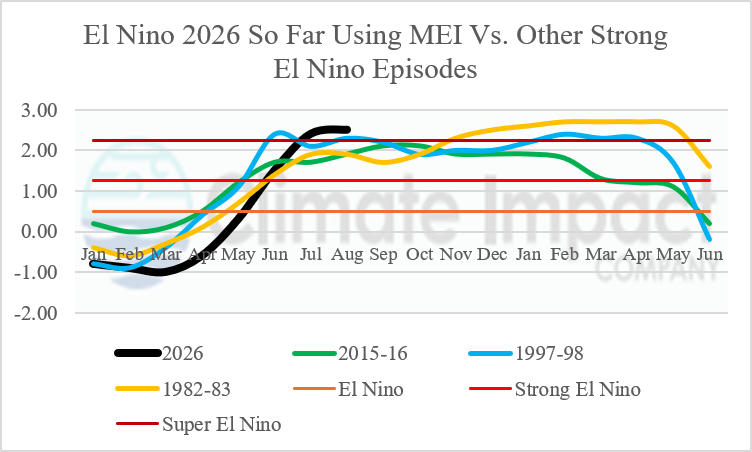
Fig. 1: Latest multivariate ENSO index compared to other Super El Nino’s.
Discussion: The JUL/AUG 2026 multivariate ENSO index (MEI) was +2.5 (Fig. 1). MEI is an excellent indicator of the atmospheric response to the equatorial Pacific Ocean sea surface temperature anomaly (SSTA) regime. When comparing the JUL/AUG 2026 MEI with the past 3 previously most intense El Nino episodes on record, the 2026 signature ranks strongest. Note that after rapid intensification of previous strong El Nino events, there is a tendency of MEI to level off except for the 1982-83 event which peaked in strength well into the second year of the event. El Nino 2026 is expected to continue strengthening during Q4/2026 and possibly weaken more quickly than the previous 3 super El Nino episodes (Fig. 2).
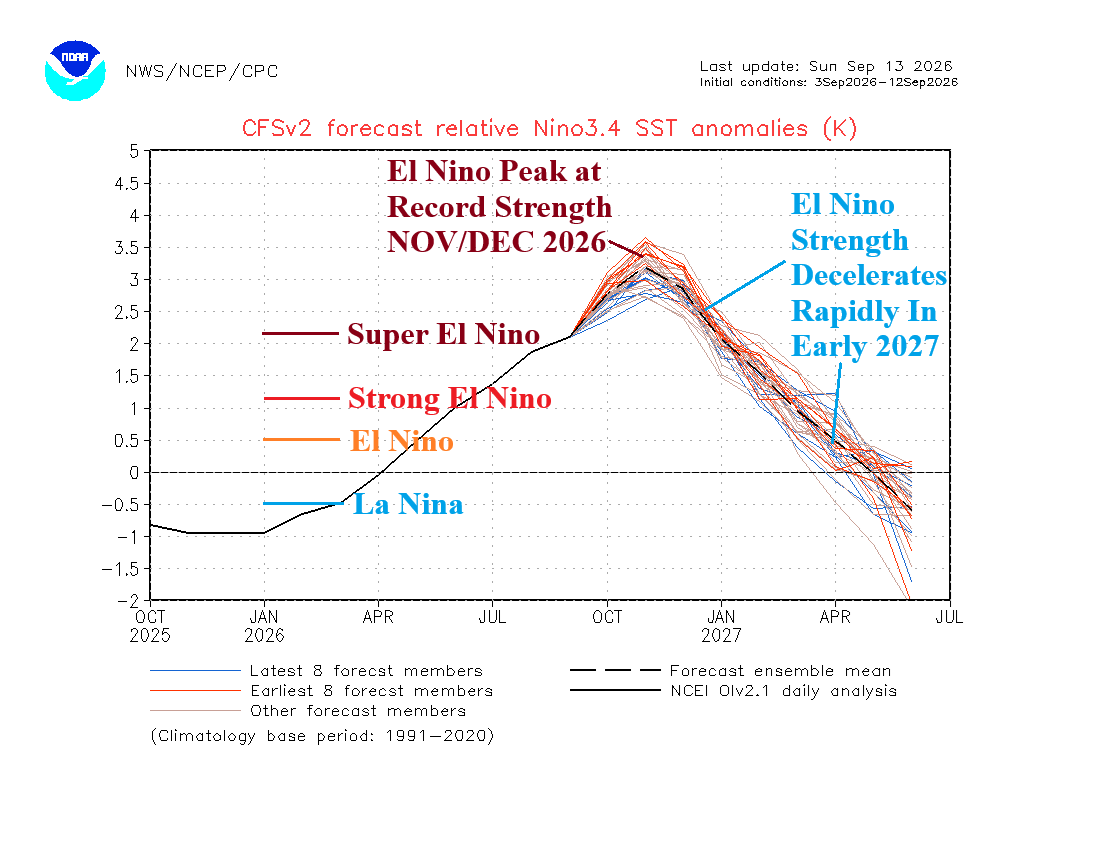
Fig. 2: CFS V2 Nino34 SSTA forecast through next June.
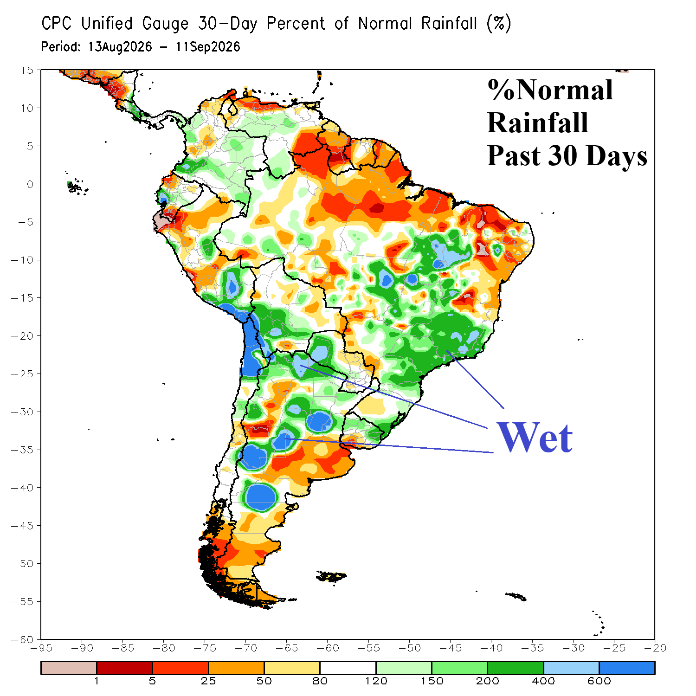
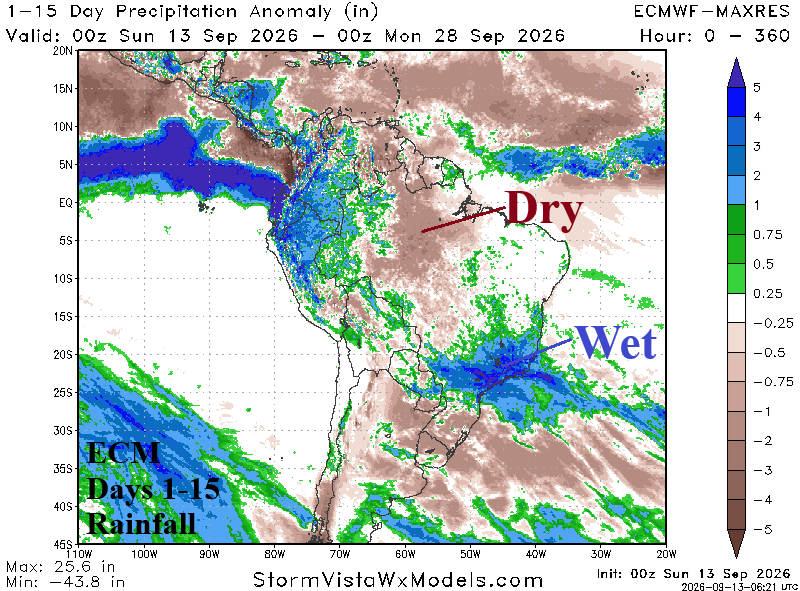
Fig. 3-4: The South America 30-day percent normal rainfall observations and ECM MAXRES 15-day rainfall anomalies forecast.
Is El Nino climate impacting global U.S. crop areas (yet)? The answer to that question is yes! Relatively early in the strong to super El Nino climate, Brazil has a tendency for wetter than normal climate as observed during late calendar winter (Fig. 3). Operational 15-day outlooks maintain the wet weather in Brazil, patchy rains in Argentina, and dryness for Western Brazil (Fig. 4). Gradually, later this spring season, the wet signature focuses on Southeast Brazil.
Similarly, Australia is observing early El Nino climate with patchy wet zones but drier in New South Wales (Fig. 5). Northeast Australia (and Indonesia) are El Nino-inspired dry climate zones. Version2 of the Google Deep Mind (model) is used to project the 15-day rainfall pattern across Australia. Version 3 is becoming available now. AI Weather Next V2 indicates classic El Nino dryness and heat in Eastern Australia during the next 15 days (Fig. 6).
Central and South India are encountering drought. However, the 10-day percent normal rainfall outlook equally combining GFS and ECM reveal a pattern change. The GFS+ECM 10-day outlook shift wet risk to West and South India during the next 10 days (Fig. 7). Areas previously very wet across North and Northeast India shift somewhat drier than normal.
Tropical West Africa is encountering drought. However, the drought region is just west of the cocoa crop zones where the 10-day rainfall outlook (equally combining GFS and ECM) is marginally wetter than normal (Fig. 8).
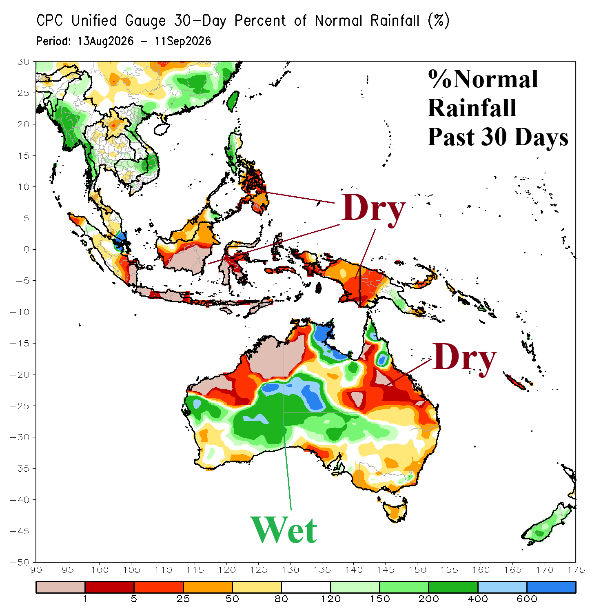
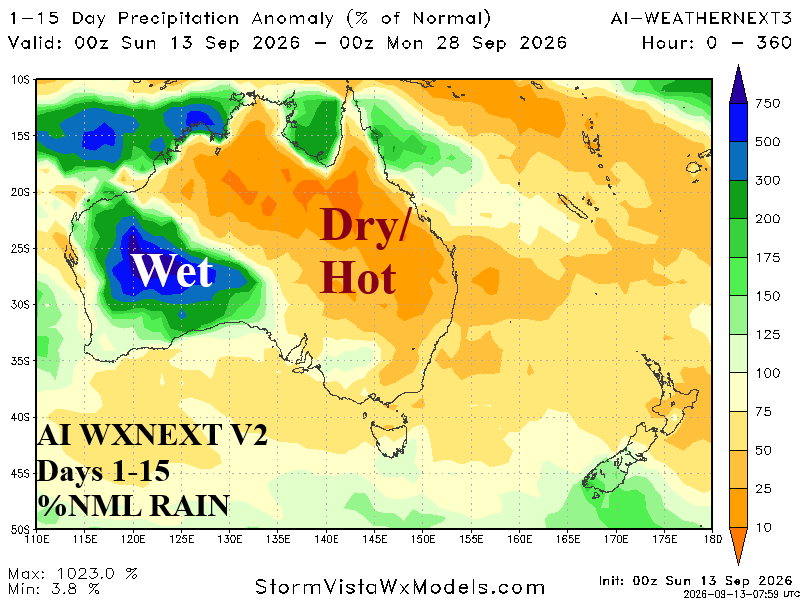
Fig. 5-6: The 30-day percent normal rainfall observations across Australia and 15-day percent of normal forecast by AI Weather Next V2.
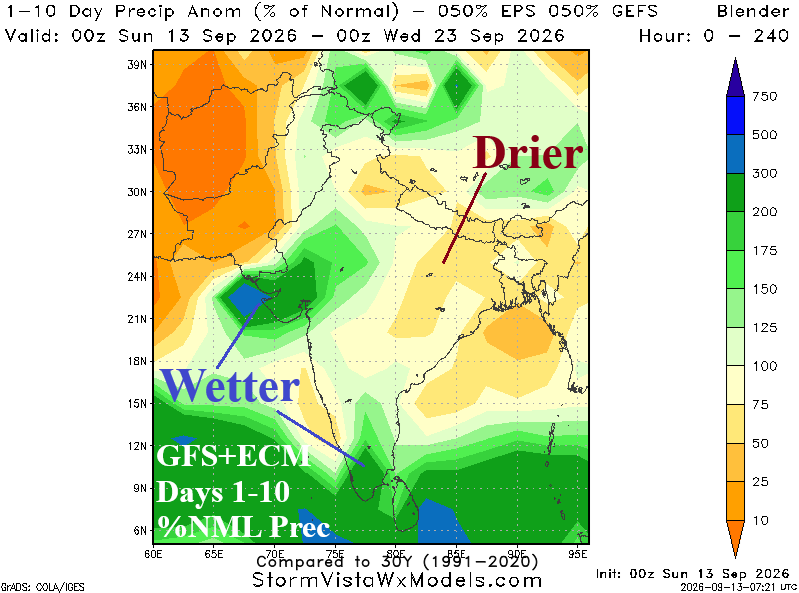
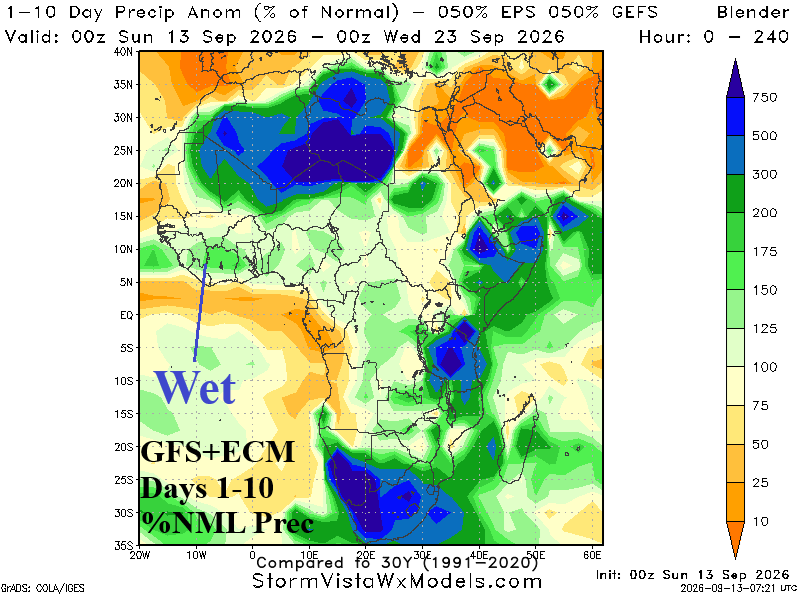
Fig. 7-8: GFS+ECM 10-day percent normal rainfall forecast for India and Africa.