Upper Ocean Heat in Tropical North Atlantic Continues to Lower
05/29/2025, 9:10 am EDT
Do Large Areas of Wet Soils Affect Summertime Temperature Regimes?
06/02/2025, 5:51 am EDT
Climate Impact Company AG Hot Spot
Issued: Sunday June 1, 2025
Highlight: ECM ENS, AI Graph Cast, and U.S. AG Belt rainfall plus updated Canada summer outlook.


Fig. 1-2: The AI Graph Cast and ECM ENS 15-day forecast rainfall bias for the past 30 days across North America.
Discussion: A notable difference between the AI Graph Cast and ECM ENS rainfall forecasts for North America during the past 30 days. The AI Graph Cast is too dry across the U.S. AG Belt (Fig. 1) while ECM ENS is too wet especially in Iowa (Fig. 2). Both forecast processes are too wet across parched Southern Canada where many brush/forest fires are continuing. The latest 15-day forecasts across the U.S. AG Belt are wetter than normal especially by ECM ENS (Fig. 3-4). Oklahoma is the heavy rain target, and ECM ENS is farther north, into the Corn Belt compared with Graph Cast in their 15-day outlook.
The Canadian Meteorological Center released their last summer 2025 probabilistic climate outlook featuring warmer than normal risk for the entire country (Fig. 5) and a new wet zone centered on the Great lakes region while the Canadian Prairies remain mostly dry maintaining nearby brush and forest fore risk (Fig. 6).
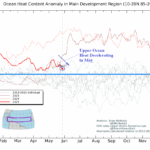
The May upper ocean heat anomaly analysis across the equatorial Pacific indicates steady warming, close to El Nino threshold levels (Fig. 7). ENSO forecasts are neutral for the foreseeable future slightly in favor of La Nina later this year, if a (phase) change. However, the subsurface trend (a leading indicator of potential ENSO phase change) is shifting warmer.

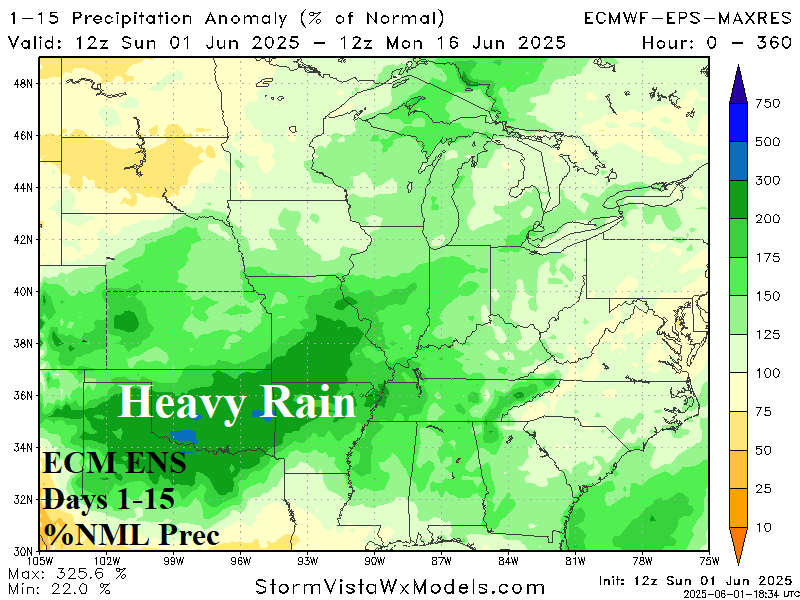
Fig. 3-4: A comparison between AI Graph Cast and ECM ENS 15-day percent of normal rainfall forecast.
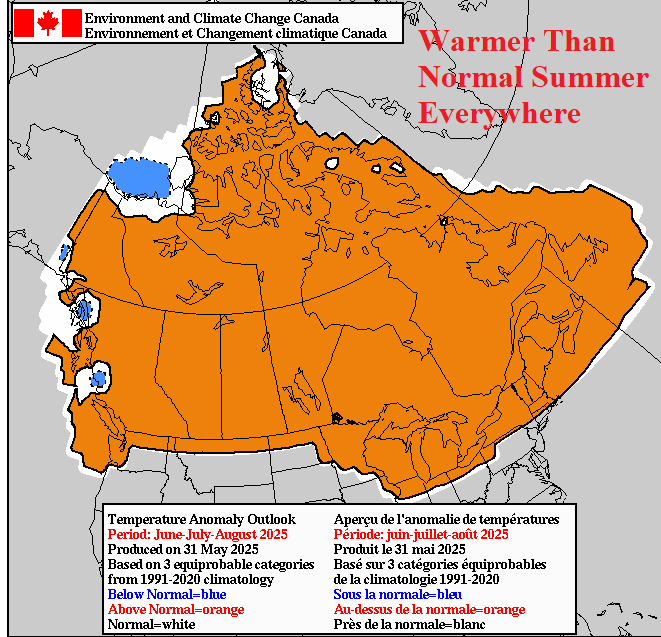
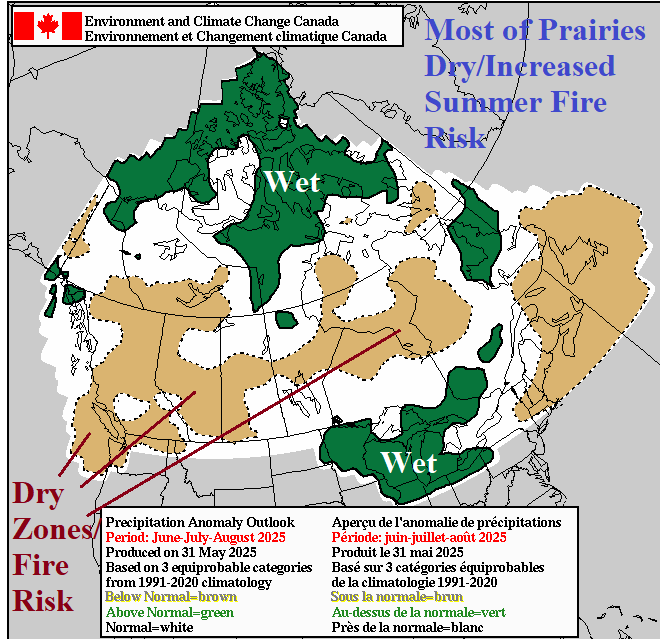
Fig. 5-6: The last probabilistic summertime climate forecast for Canada from the Canadian Meteorological Center.

Fig. 7: The 12-week Nino SSTA regions weekly SSTA analysis.