ECM ENS, AI Graph Cast, and U.S. AG Belt Rainfall
06/01/2025, 3:54 pm EDT
Possible Wetter Changes Ahead in Canada
06/05/2025, 5:53 am EDT
Climate Impact Company Early AG Market ALERT
Issued: Monday June 2, 2025
Highlight: Large (wet) soil moisture regimes influence on climate.
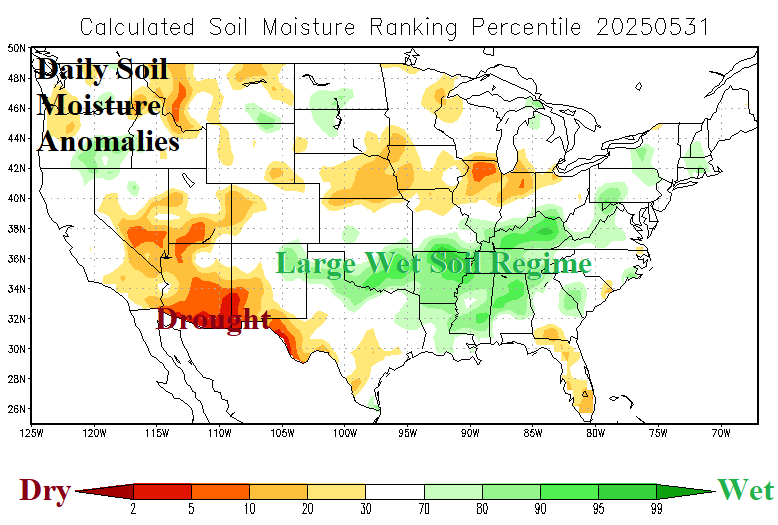

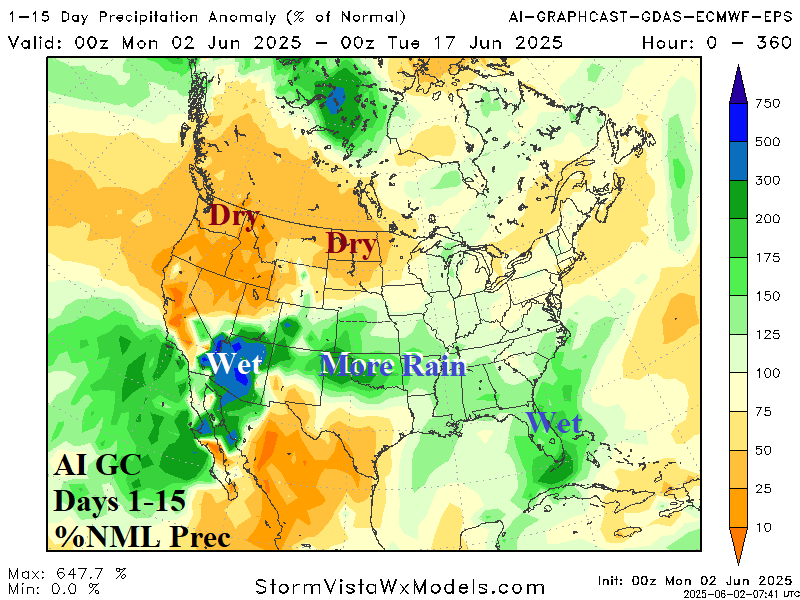
Fig. 1-3: The daily soil moisture anomaly analysis across the U.S. and AI Graph Cast 15-day temperature anomaly and percent of normal rainfall forecast.
Discussion: Vividly displayed to start meteorological summer is the influence a large area of wet soil conditions has on the prevailing weather pattern. The mid-to-late spring heavy rains have turned the Mid-south U.S. (and vicinity) soaking wet (Fig. 1). The 15-day temperature anomaly outlook by AI Graph Cast projects a large area of suppressed heat risk (Fig. 2) across the wet soil region (and vicinity). Wet soil conditions encourage increased evaporation to produce clouds and rain to prevent anomalous heat. The AI Graph Cast maintains the wet pattern across the southern Great Plains to the Mid-south States in the latest 15-day outlook (Fig. 3). In Europe, wet soil regions are somewhat smaller centered on Romania and Spain (Fig. 4). Therefore, direct influence on the prevailing climate is smaller. In fact, the AI Graph Cast 15-day temperature and percent of normal rainfall forecast (Fig. 5-6) indicate a broadening area of periodic heat and dry weather implying the dry-to-drought soil moisture conditions across parts of Europe (and Southwest Russia) will expand southward during the first half of July.


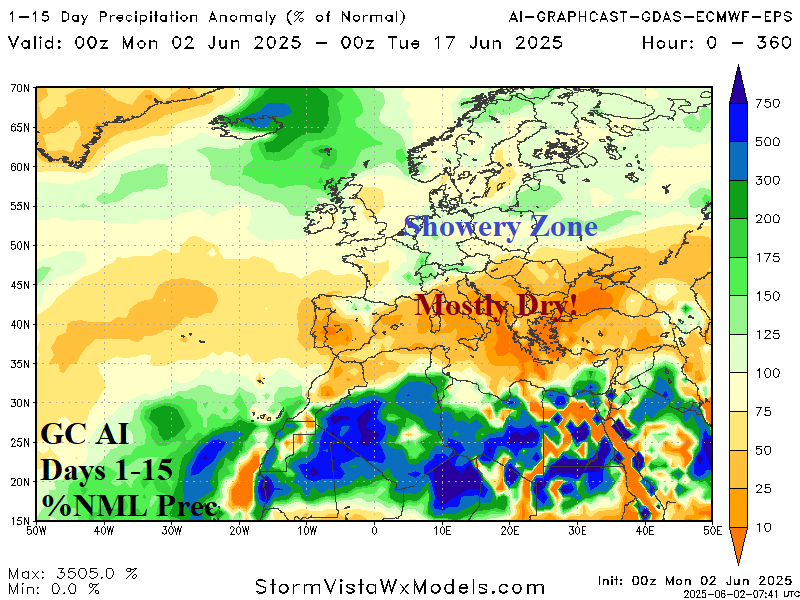
Fig. 4-6: The daily soil moisture anomaly analysis across Europe and AI Graph Cast 15-day temperature anomaly and percent of normal rainfall forecast.


