
Negative Scandinavia Index Pattern Develops; Cools/Soaks North/Central Europe
05/27/2025, 5:32 am EDT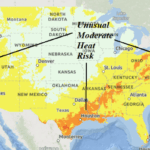
June 1 Arrives; Monitoring for Extreme Heat Begins
06/01/2025, 9:38 am EDT
Climate Impact Company Early AG Market ALERT
Issued: Thursday May 29, 2025
Highlight: U.S. AG is wetter/cooler, Europe drought eases in June.
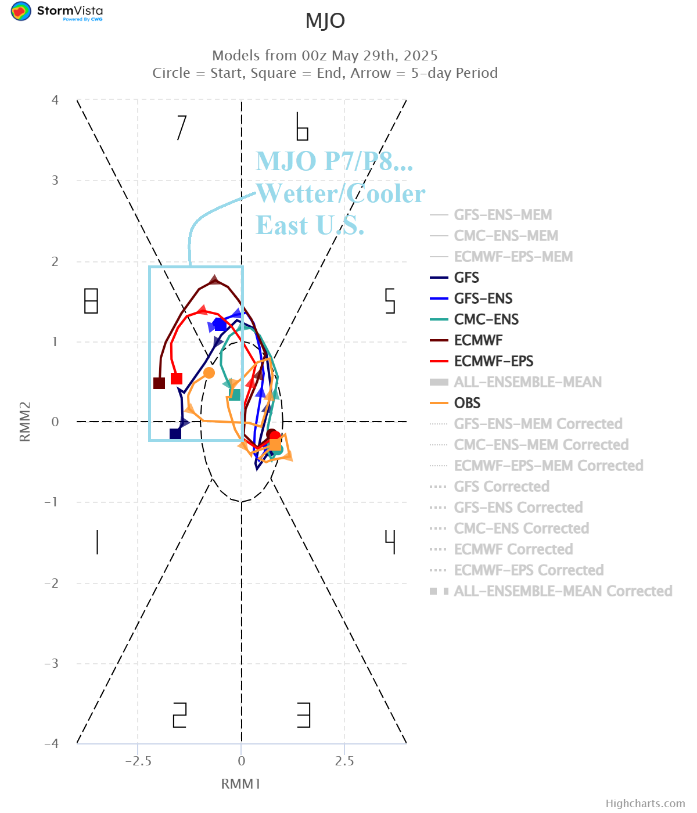
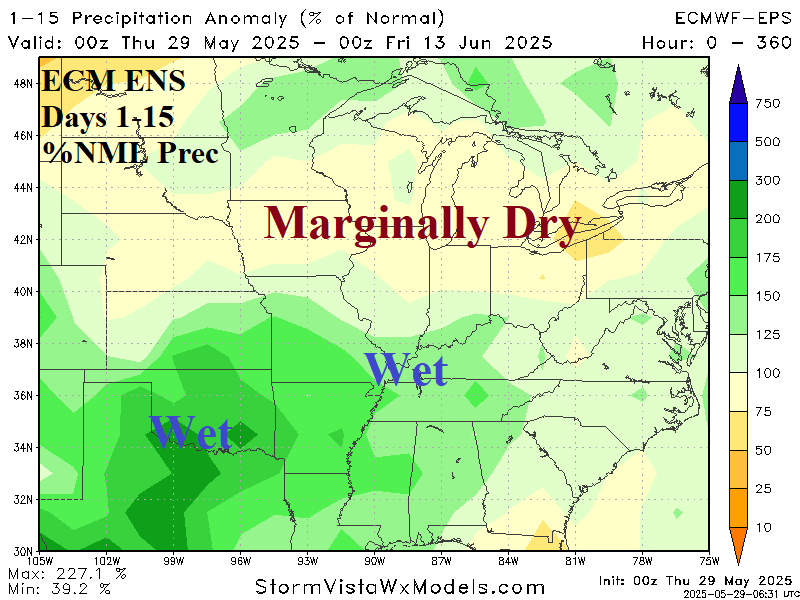
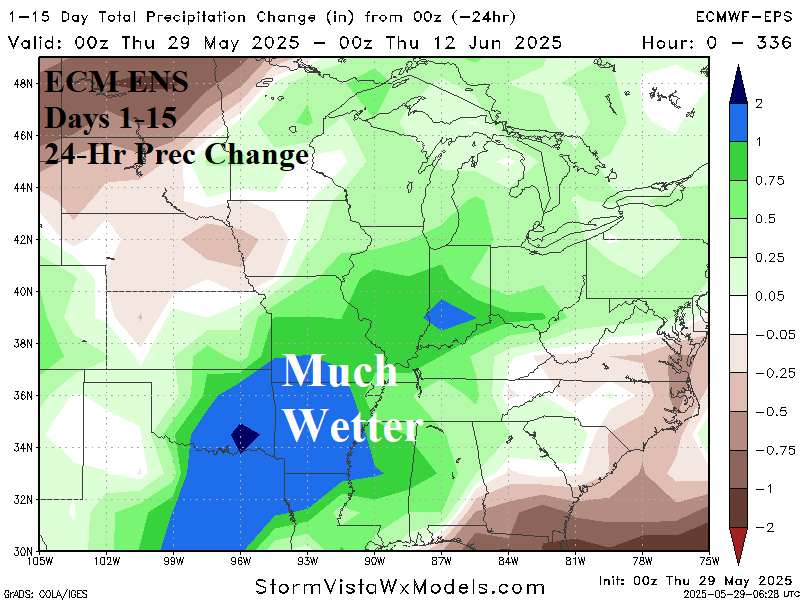

Fig. 1-4: The 14-day MJO forecast, U.S. AG Belt percent of normal rainfall 15-day forecast, and 24-hour change plus the 15-day temperature anomaly forecast.
Discussion: The Madden Julian oscillation 14-day forecast settles on phase_7/phase_8 during the medium range (Fig. 1) with increasing intensity justifying a cooler and wetter East U.S. forecast. The ECM ENS 15-day percent of normal rainfall outlook indicates wet weather, possibly heavy rain in the southern Great Plains with the wet regime expanding to the Tennessee Valley and southern Ohio Valley (Fig. 2). All models, including the ECM ENS, are much wetter from 24 hours ago (Fig. 3) due to the stronger MJO influence. The wetter trend invites a sustained cooler pattern (Fig. 4). The already wet soils centered on the Mid-south U.S. trend wetter in the MJO-inspired wet regime. A large wet soil region will bias warm season climate cooler (and sometimes wetter). The CFS V2 June 2025 temperature and precipitation anomaly outlook shift cooler and wetter across the southern Great Plains and vicinity (Fig. 5-6).


Fig. 5-6: The CFS V2 U.S. temperature and precipitation anomaly forecast for June 2025.
Off the West Coast of Europe, a large marine heatwave has formed (Fig. 7). The warming has intensified during May. Consequently, climate forecasts for early meteorological summer center a 500 MB anomaly ridge over the MHW during June with a compensating weak upper trough over Europe (Fig. 8). Farther downstream, an amplified upper ridge is projected for Western Russia to compensate for the Europe trough. The sensible weather pattern shifts wetter across the Europe Drought region from France to Ukraine while anomalous warmth and dryness spreads across West and West-central Russia during June 2025.

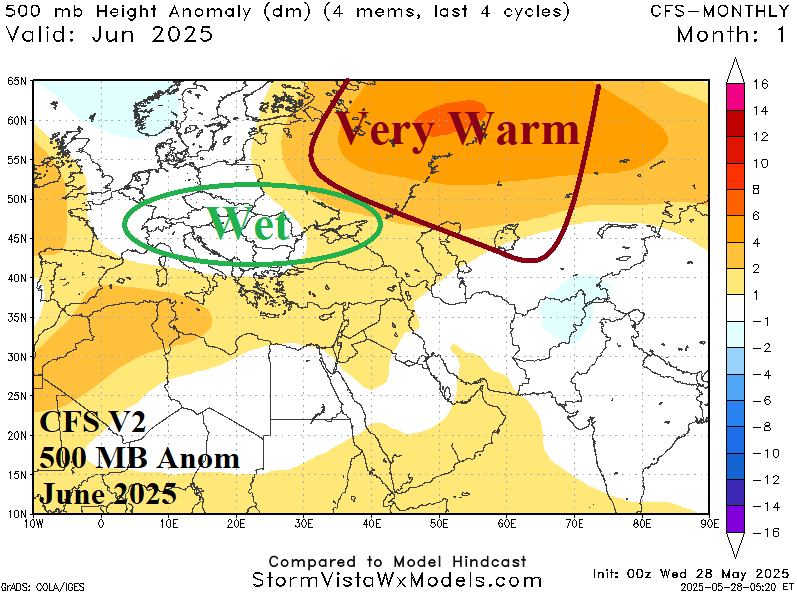
Fig. 7-8: The daily SSTA analysis across the North Atlantic identifies a marine heat wave west of Europe and the CFS V2 upper air forecast for June 2025.
The season’s first cool surge into Brazil arrives before meteorological winter begins. Forecast models remain consistent forecasting <32F risk to the south of the Brazil Coffee Areas tomorrow morning (Fig. 9). The wetter MJO influence on the U.S. medium range is less profound in Brazil where central/east Brazil are dry during the 8-14-day period (Fig. 10). However, Southeast Brazil shifts much wetter during that timeframe.
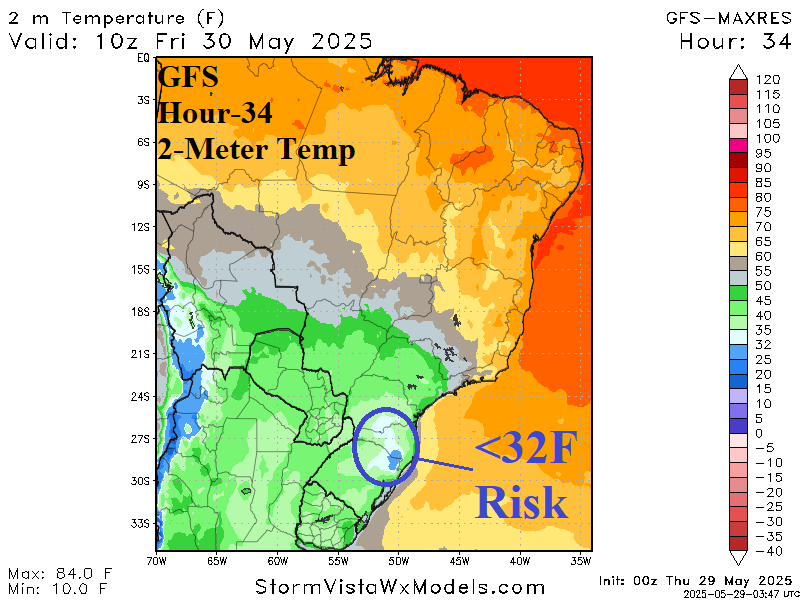

Fig. 9-10: The GFS 34-hour 2-meter temperature forecast and 8-14-day percent of normal rainfall outlook.