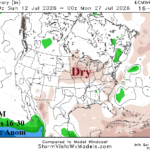
ALERT Issued for Hot/Dry Weather Centered on Western U.S. Corn Belt Later July
06/28/2026, 1:29 pm EDT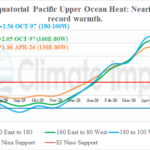
Upper Equatorial Pacific Ocean Anomalous Heat Breaking Records
07/01/2026, 1:14 pm EDT
Climate Impact Company ENSO Climate Diagnostics
Issued: Tuesday June 30, 2026
Highlight: Immense upper ocean heat fueling the warming equatorial East Pacific causing strong El Nino threshold influence on the atmosphere.
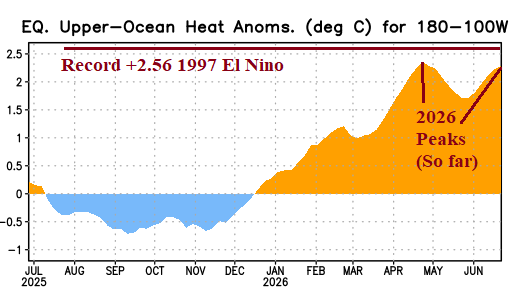
Fig. 1: Upper ocean heat anomalies in the equatorial Pacific Ocean east of the Dateline.
Discussion: The weekly ENSO report is divided into 3 parts: 1.) Upper ocean heat/energy supply for El Nino; 2.) Oceanic El Nino status, and 3.) Atmospheric El Nino status. The upper ocean heat spiked during late April, cooled slightly in May, and regenerated in June and should pass the intensity of the April surge during July (Fig. 1). The upper ocean heat/fuel for El Nino is likely to approach the all-time record warm subsurface observation in the eastern half of the equatorial Pacific Ocean observed during the historic 1997-98 El Nino episode. Based on subsurface potential energy, perfectly reasonable is the projection of the 2026-27 El Nino to rival the intensity of the 1997-98 event.
Oceanic El Nino, as defined by the Nino SSTA regions, is warm to very warm and getting warmer. The conventional Nino34 SSTA has passed the strong El Nino threshold of +1.5C reaching +1.8C during the past week (Fig. 2). The new relative Nino34 SSTA index is fast approaching the strong El Nino threshold. “Strong” oceanic El Nino is forming with (much) further intensification ahead for the second half of the year,
Atmospheric El Nino, best defined by multivariate ENSO index (MEI), which was near the weak El Nino threshold in late May will shift into the El Nino category with June observations reported in about 10 days. The daily southern oscillation index (SOI) is a good (daily) indicator of the tropical atmospheric response to SSTA warming of the eastern equatorial Pacific Ocean. The SOI is negative, averaging near the strong El Nino atmosphere value during the past 30 days (Fig. 3). Further intensification is expected the second half of the year,
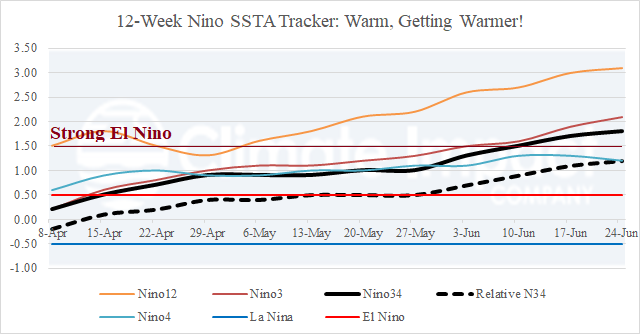
Fig. 2: Oceanic El Nino intensity as defined by the Nino SSTA regions tracking for 12 weeks.
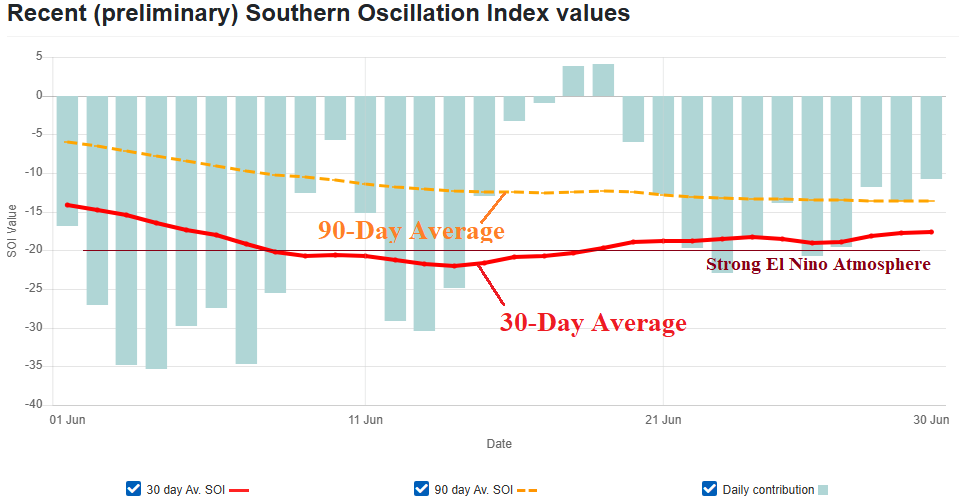
Fig. 3: Daily southern oscillation index for the past 30 days, 30-day average, and 90-day average.