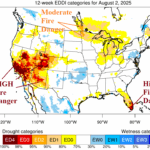
Evaporative Drought Demand Index Identifies U.S. Fire Risk Areas
08/07/2025, 9:08 am EDT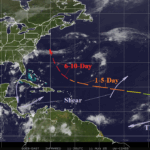
The Risk of 97L Strengthening and Eventually Becoming an East Coast Problem Increasing
08/11/2025, 8:58 am EDT
Climate Impact Company Week 2-4 Outlook
North America
Issued: Friday, August 8, 2025
Highlight: Cool start to August flips much hotter mid-to-late month.
Charts of the day: Comparing best 2 “weeklies” models past 14 days.

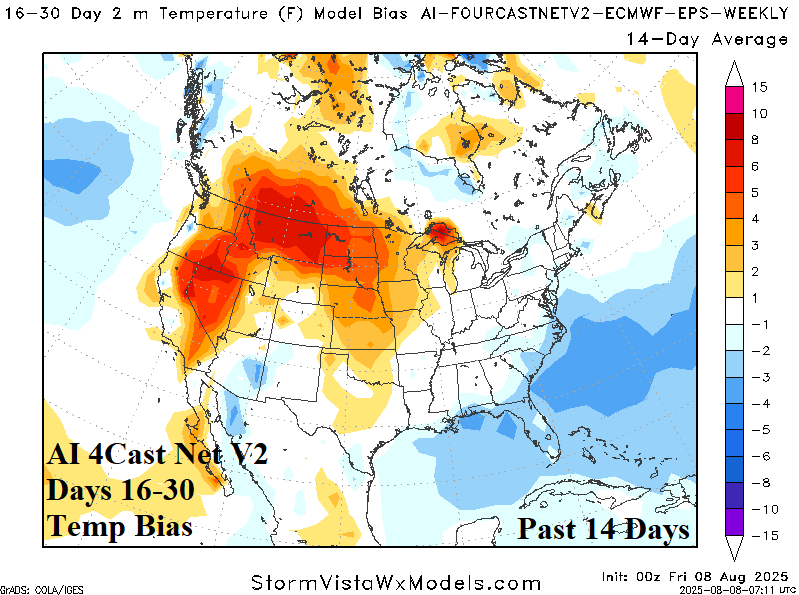
Discussion: The temperature forecast bias among two leading “weeklies” forecast models is clearly too hot in the 16-30-day period across the West and Central U.S. The explanation for the warm (ECM) bias is presence of an unusually strong summertime polar vortex over Greenland with a southward extending upper trough occasionally visiting the West U.S. The upper trough is generally not forecast by (all) models in the 16-30-day period therefore the sensible temperature outlook is too hot. Interestingly, to compensate for the polar vortex, an unusually strong high-pressure ridge has caused persistent anomalous heat in the East which the “weeklies” have done an excellent job forecasting during the 16-30-day period. Machine learning models are not quite as warm-biased West as the dynamic models. Therefore, we’ll use the AI projection in today’s week 2-4 outlook for temperature.
Week-2 Ahead Forecast valid August 17-24, 2025: Gulf TC risk; Hot pattern!

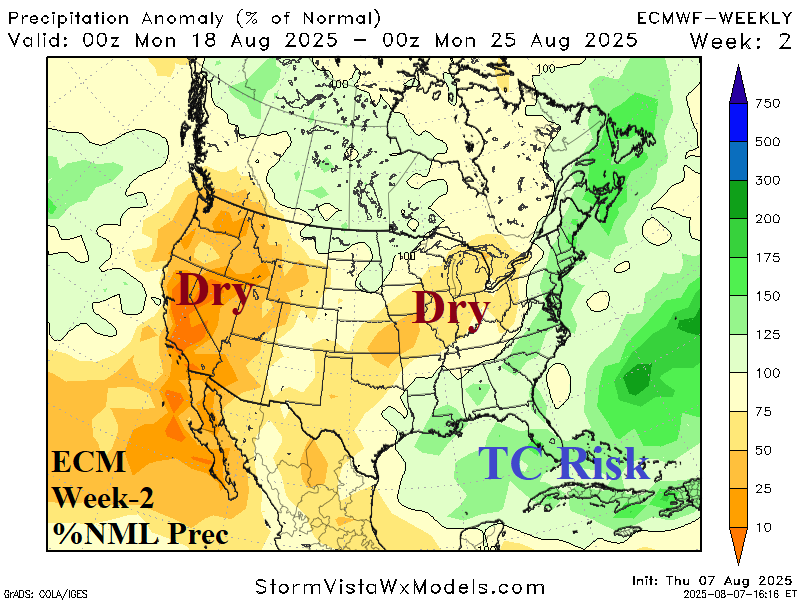
Discussion: Just-after mid-August, high impact weather affecting the U.S. includes a tropical cyclone risk in the Gulf of Mexico arriving from the Bahamas or the Northern Caribbean Sea. The West and Central U.S. to the Ohio Valley is dry and hot. The East Coast shifts wetter in a forecast change.
Week-3 Ahead Forecast valid August 24-31, 2025: Support for West U.S. warming.
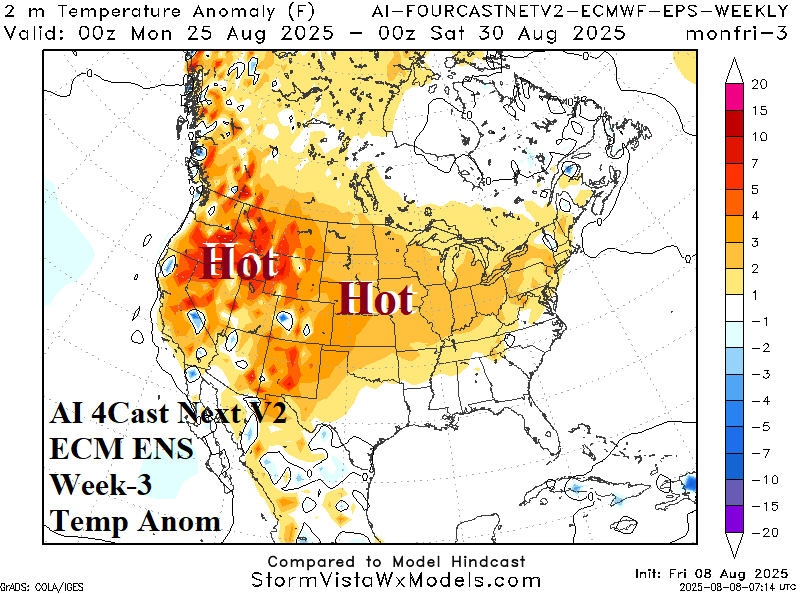

Discussion: Anomalous heat stretches across the U.S., most intense in the Northwest. The warmer Northwest regime is supported by the warming of the Northeast Pacific. Much of the U.S. is drier than normal. The West U.S. drought is accelerating and fire danger increasing dramatically.
Week-4 Ahead Forecast valid August 31-September 7, 2025: AI less hot; ECM maintains heat.
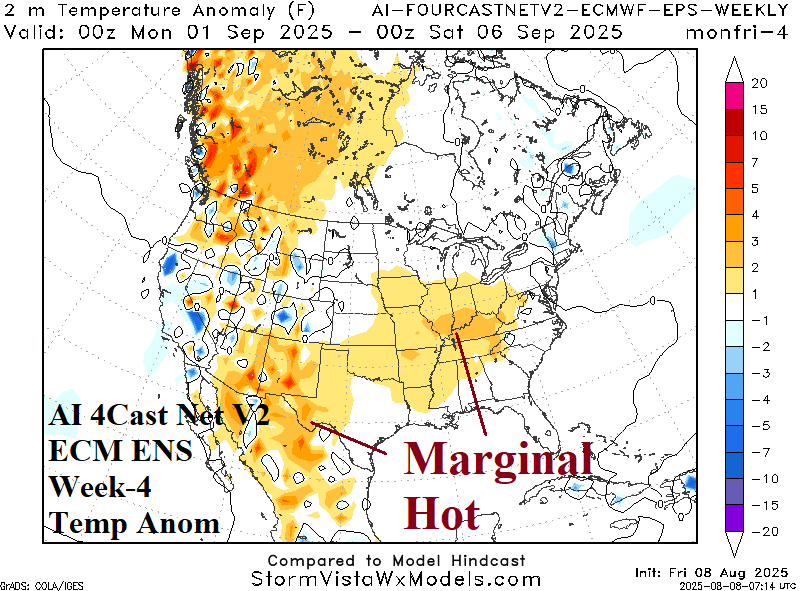
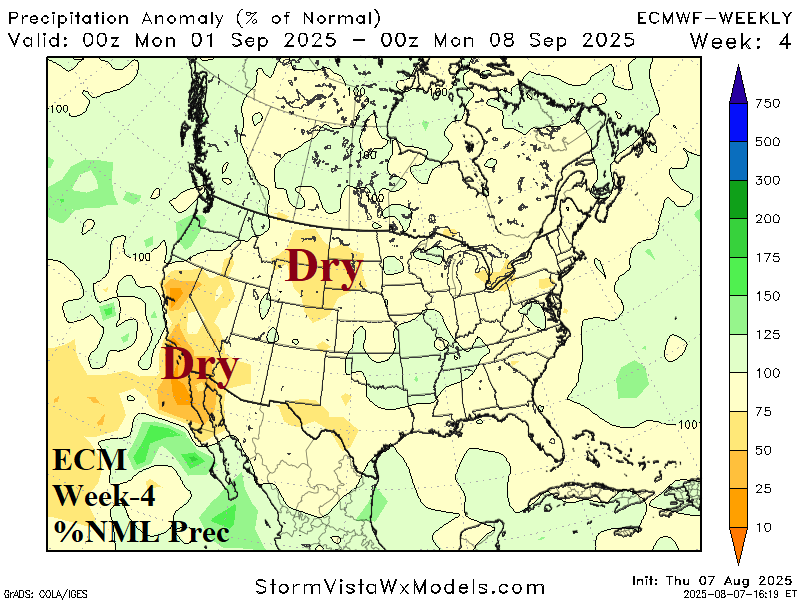
Discussion: The AI forecast significantly diminishes the anomalous heat in early September. Widespread dryness continues based on the ECM outlook (which is warmer than AI).