West Pacific Marine Heatwave Maintains China/Japan Excessive Heat Risk
08/01/2025, 12:06 pm EDT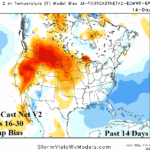
Comparing “Weeklies” Temperature Forecast Bias
08/08/2025, 8:20 am EDT
Climate Impact Company U.S. Medium Range Report
Issued: Thursday August 7, 2025
Highlight: Hot pattern continues! New AIFS ENS scores no. 1 for past 30 days in medium range.
Chart of the day: Evaporative Drought Demand Index.

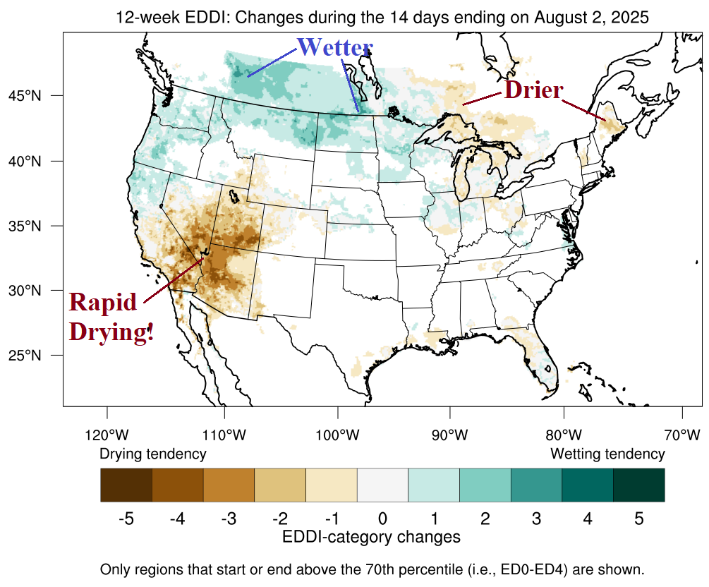
Discussion: The 12-week Evaporative Drought Demand Index (EDDI) reveals U.S. areas most susceptible to fire risk for late meteorological summer/early autumn. The highest alert, ED3/ED4 is spread across central and southern California, much of the Great Basin, and Arizona. A second area susceptible to high fire risk is south/southeast Florida. Moderate fire risk extends across the Upper Midwest, Great Lakes region to southern Ontario. During the past 14 days, the 12-week EDDI has shifted rapidly drier across the Great Basin, Arizona., and Southern California. Much wetter EDDI tendency is indicated across the Canadian Prairies into parts of the Northwest U.S. The EDDI observations and trends are an excellent guide to where fire risk is highest and where areas with fires are most susceptible to rapid spreading.
Medium-range 6-10 Day Forecast Valid August 12-16, 2025 (24-hour change right)
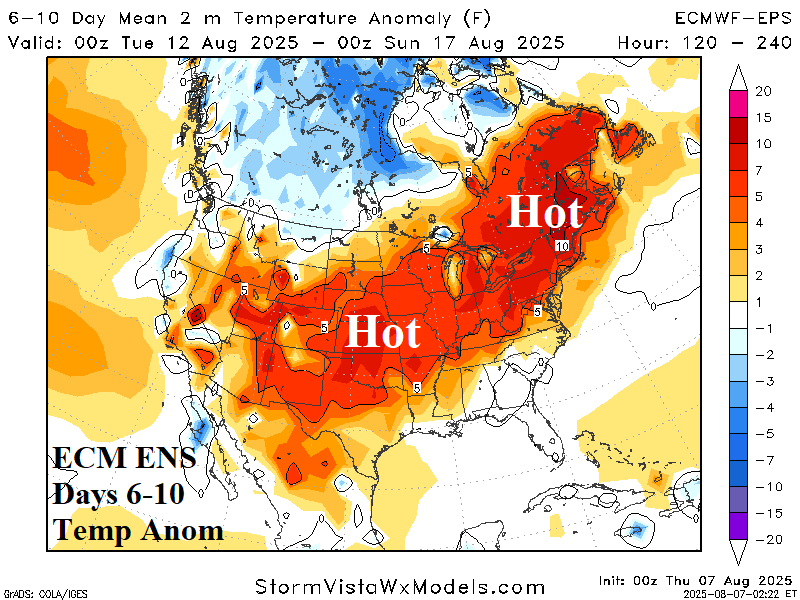

Discussion: AIFS ENS verification statistics reveal a number 1 ranking for both the 6-10-day and 11-15-day forecast from the past 30 days! Today’s operational 6-10-day forecast reveals the ECM ENS is slightly hotter than AIFS ENS while AIFS is cooler across West-central Canada.
Medium-range 11-15 Day Forecast Valid August 17-21, 2025 (24-hour change right)
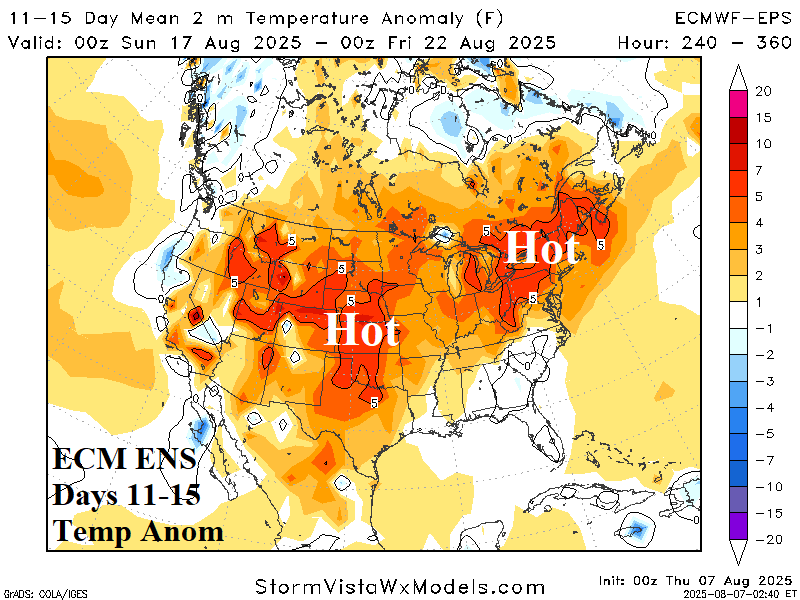
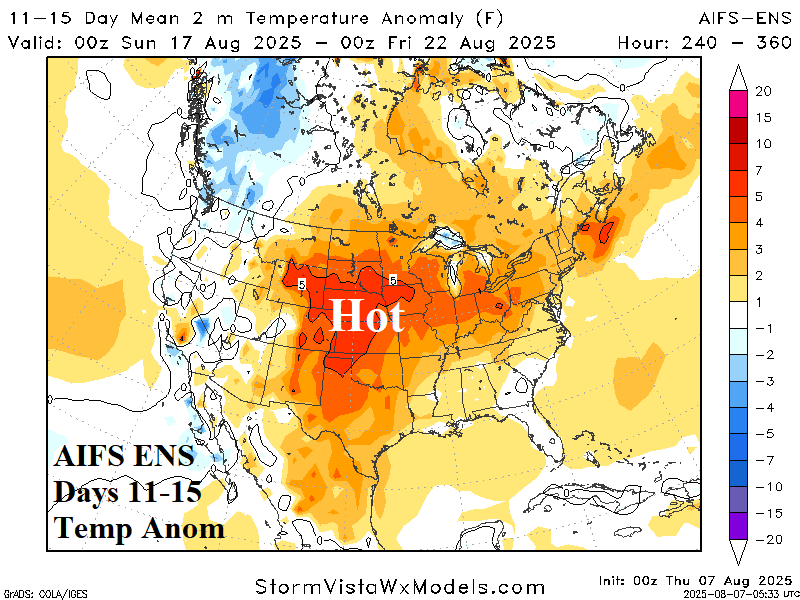
Discussion: AIFS is shifting the core of the heat to the central Great Plains while ECM ENS maintains a hot signature in the Northeast. AIFS ENS is cooler than ECM ENS across the western continent. The Northeast heat may be overdone due to a wetter trend.
U.S. Medium-range Precipitation Forecast
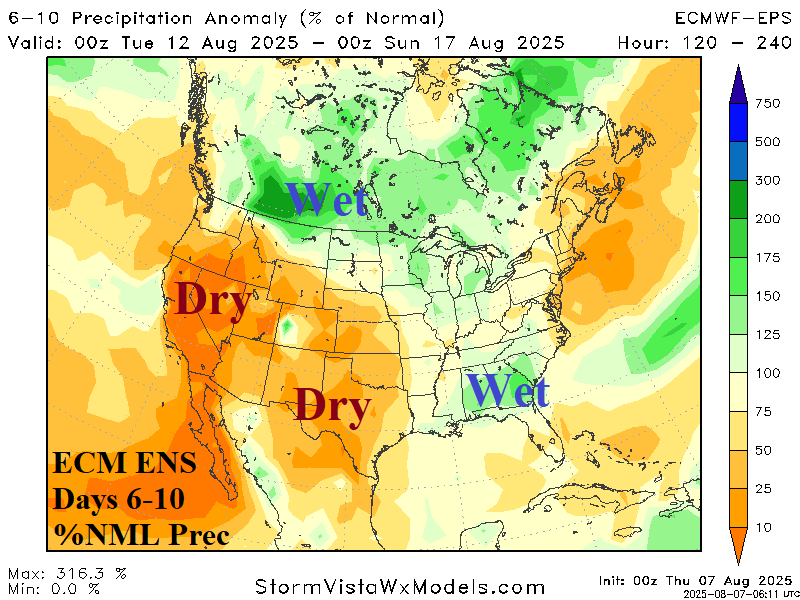
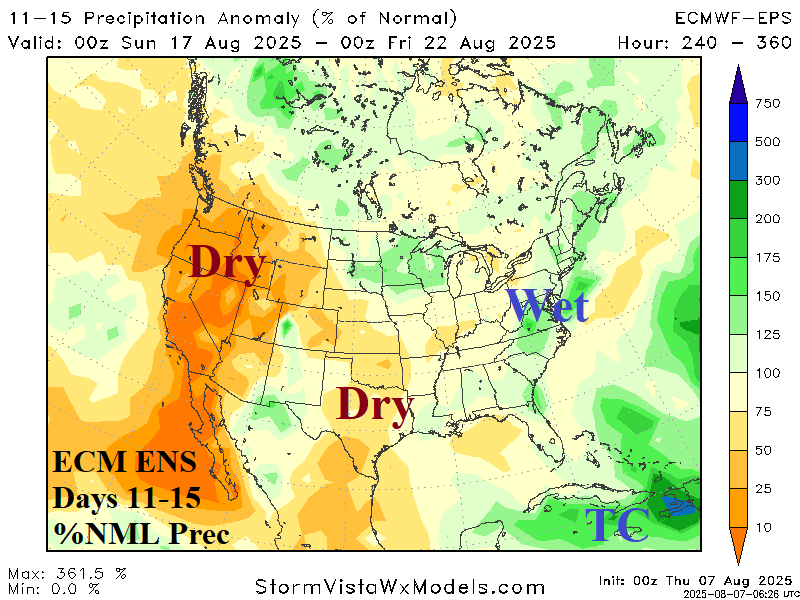
Discussion: The medium range forecast emphasizes dryness in the West and Texas and a little less interested in tropical cyclone generation. The East Coast is wetter due to thundershowers in the 11-15-day period. There are signs of a tropical system in the Caribbean Sea (and northward).
Days 16-20 Extended range Temperature Forecast valid August 22-26, 2025
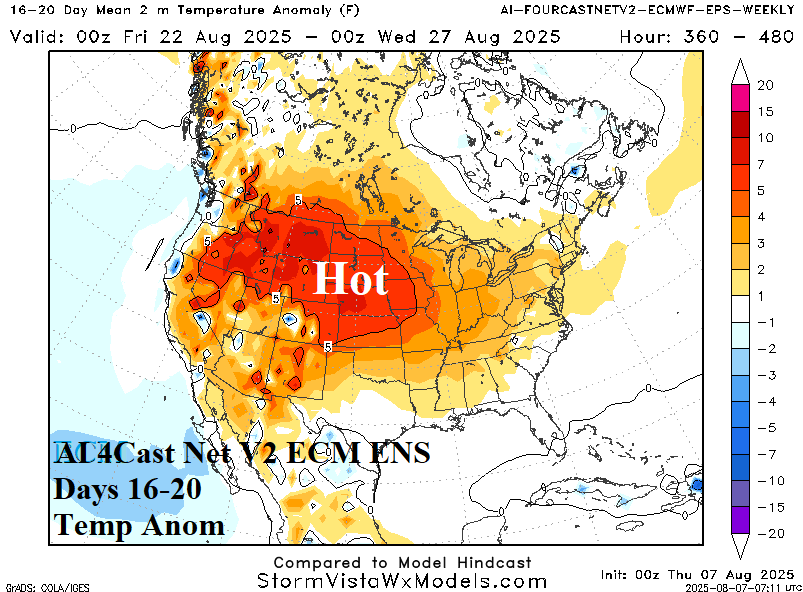
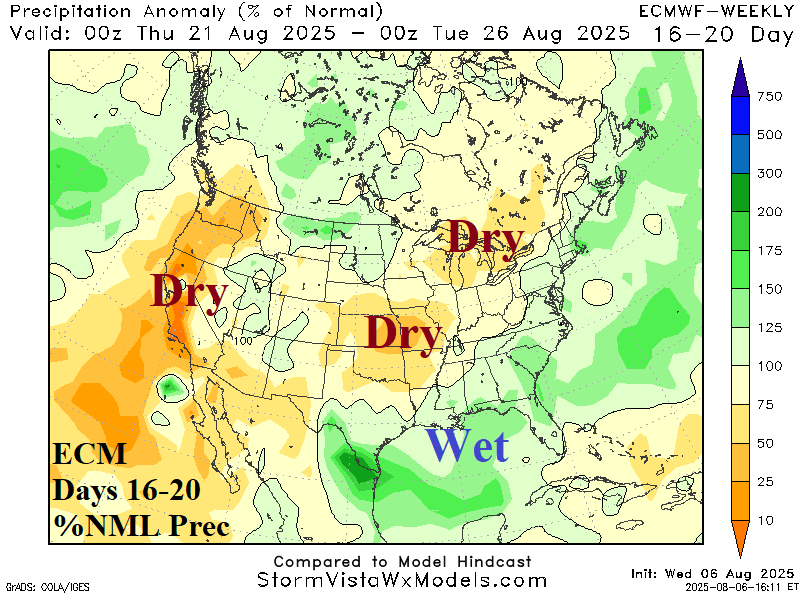
Discussion: The AI 4Cast Net V2 ECM ENS indicates the hot U.S. pattern continues expanding from the Central U.S. to Interior West. The Gulf States are wetter than normal possibly due to tropical influences.