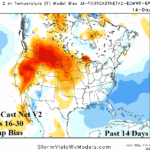
Comparing “Weeklies” Temperature Forecast Bias
08/08/2025, 8:20 am EDT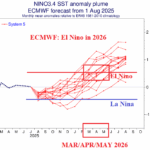
ECMWF Projects El Nino for 2026
08/12/2025, 9:32 am EDT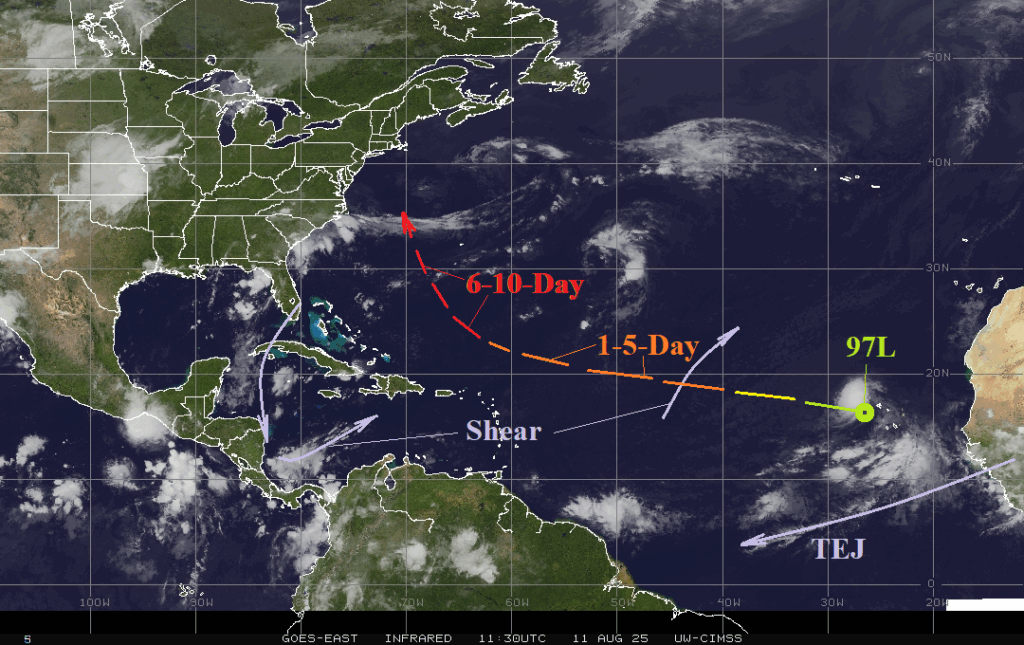

Climate Impact Company North Atlantic Basin 10-Day Monitor
Issued: Monday August 11, 2025, 8:25AM EDT
Highlight: The risk of 97L strengthening to a tropical cyclone and eventually becoming an East Coast problem is increasing.
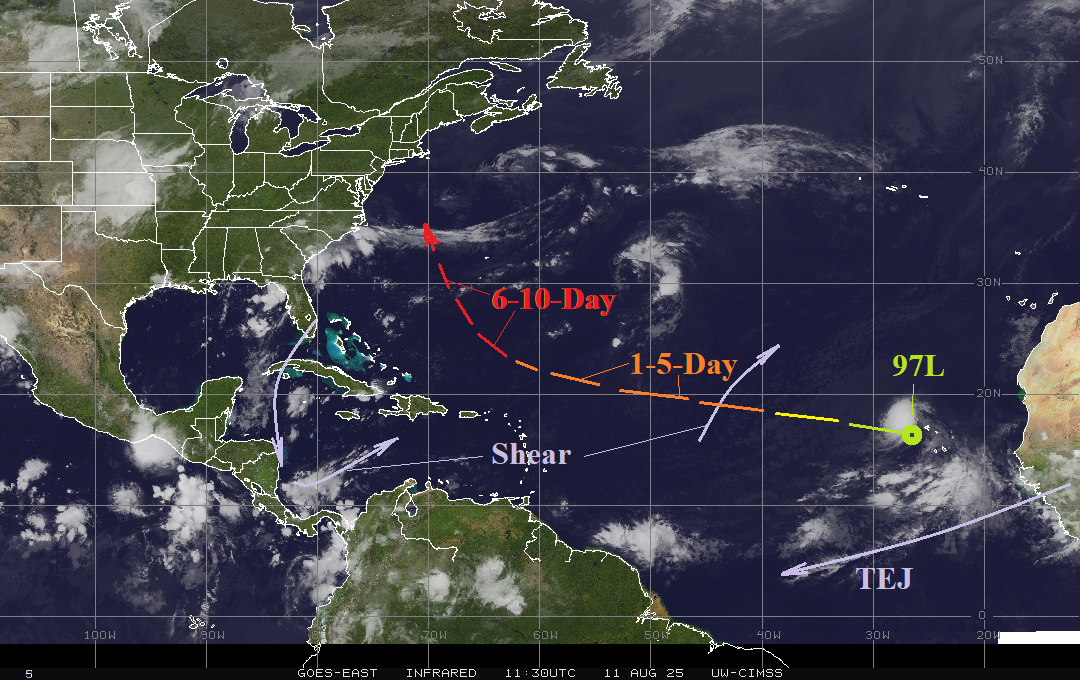
Fig. 1: The latest weather-satellite view of the North Atlantic basin.
Discussion: Operational models (GFS and ECM) are remarkably similar with the extended range (days 6-10) forecast of Tropical Disturbance 97L (Fig. 1). NOAA/NHC indicates a high probability of a named storm within 48 hours, and tropical cyclone models indicate a steady westward track with intensification to a hurricane in 4-5 days (Fig. 2-3). The GFS and ECM are slightly north of tropical cyclone models in 5 days. During the 6-10-day period a hurricane drifts northwestward and turns north (hopefully) at 70W before a northeast turn to the east of New England early in the 11-15-day period. The risk of 97L eventually becoming an East Coast problem is increasing.
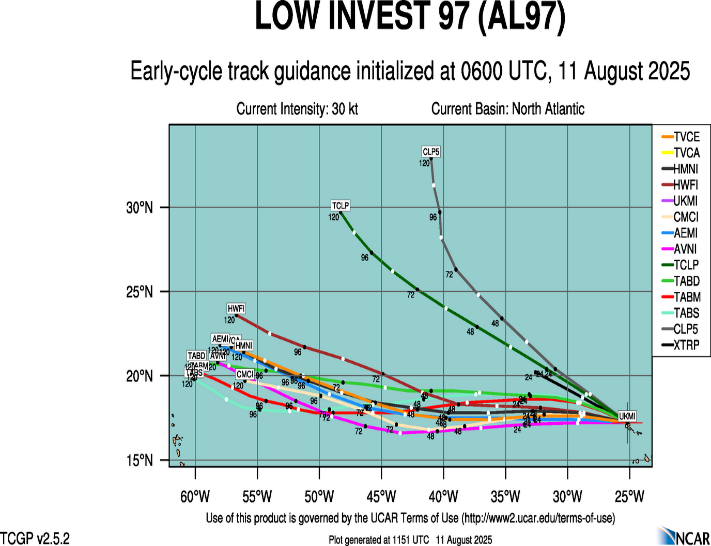
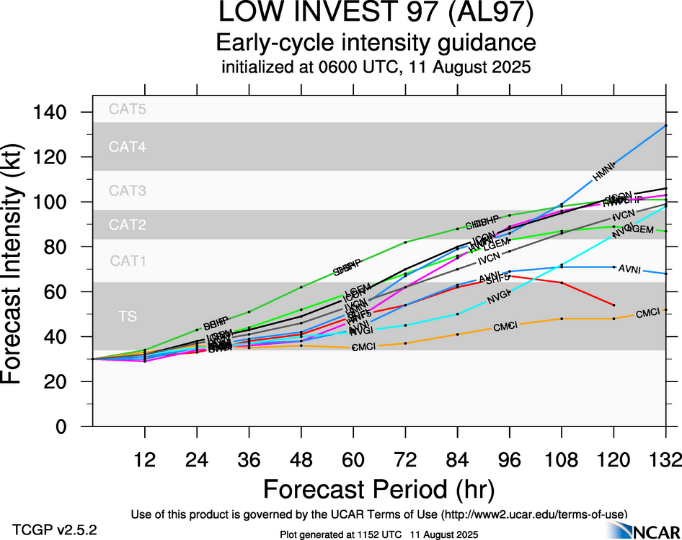
Fig. 2-3: The tropical cyclone model tracks and intensity forecast for 97L.
So far, in August, sea level pressure anomalies have been positive in the central and western North Atlantic basin which is an inhibiting factor for tropical cyclone development (Fig. 4). Saharan dust is not a significant issue this year with only patchy moderate dust clouds indicated by the CAMS model (Fig. 5). Tropical Africa is getting wetter and the ability to generate potent tropical waves off the West Africa Coast is increasing (Fig. 6).
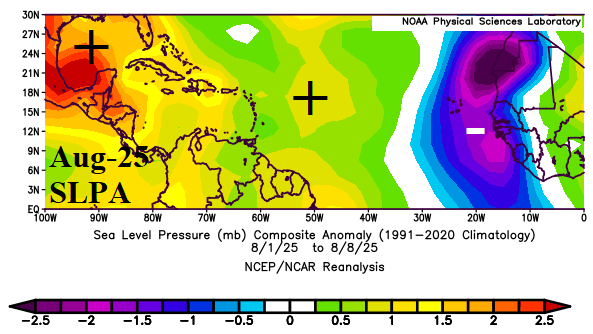
Fig. 4: August 2025 sea level pressure anomalies (so far) for the North Atlantic tropics.
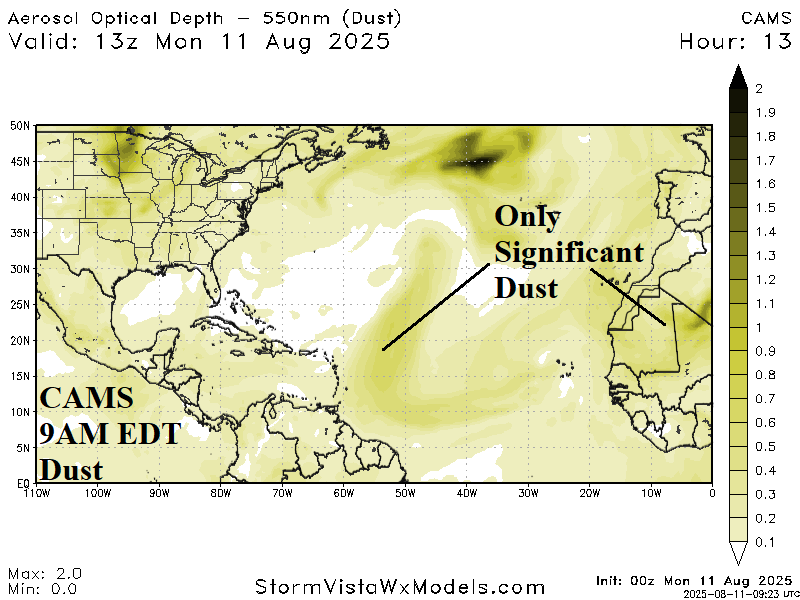
Fig. 5: CAMS projection of dust across the North Atlantic basin valid at 9AM EDT.
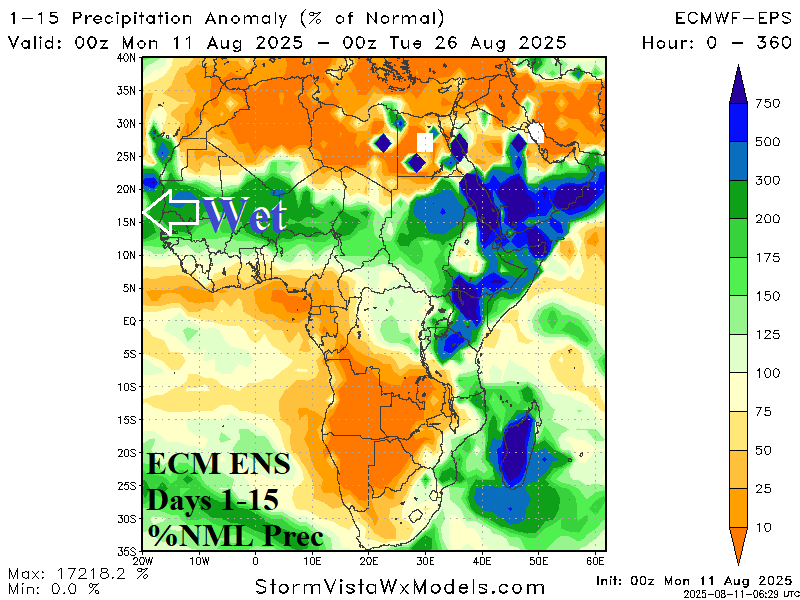
Fig. 6: ECM ENS 15-day forecast of percent of normal rainfall across Africa.