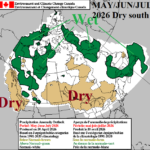
A Dry Southern Canada MAY-JUL 2026 Forecast by Canadian Meteorological Center
05/01/2026, 8:45 am EDT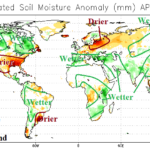
Global Soil Moisture Anomalies Observations and Trend
05/08/2026, 9:50 am EDT
![]()
Climate Impact Company U.S. Sunday Report
Issued: Sunday, May 3, 2026
Highlight: Turning warmer East this week then wet/cooler late week. More significant rain is possible in the medium range. Week-3 differences for Northeast forecasts.
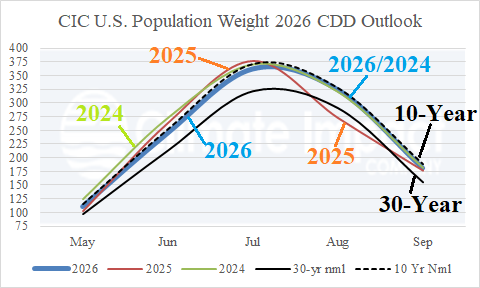
Fig. 1: Climate Impact Company U.S. population weight CDD forecast for the 2025 warm season compared to 2025 and 2024 plus the 30-year/10-year normal.
Discussion: The U.S. population weight CDD observation for April was 55 which is well above the already warm 10-year normal (40). The Climate Impact Company U.S. population weight CDD forecast for the 2026 warm season (Fig. 1) averages near or slightly below normal. The MAY/JUN (national) forecast is warm, near the 10-year normal, but lacking extreme heat as observed during MAY/JUN 2024 and JUN 2025. The JUL 2026 forecast is slightly below the 10-year normal and similar with the past 2 mid-summer(s). The AUG/SEP 2026 forecast is similar with 2024 and much warmer than last AUG. The hot bias for the warm season 2026 is in the West with marginal warmth in the high population East Coast.
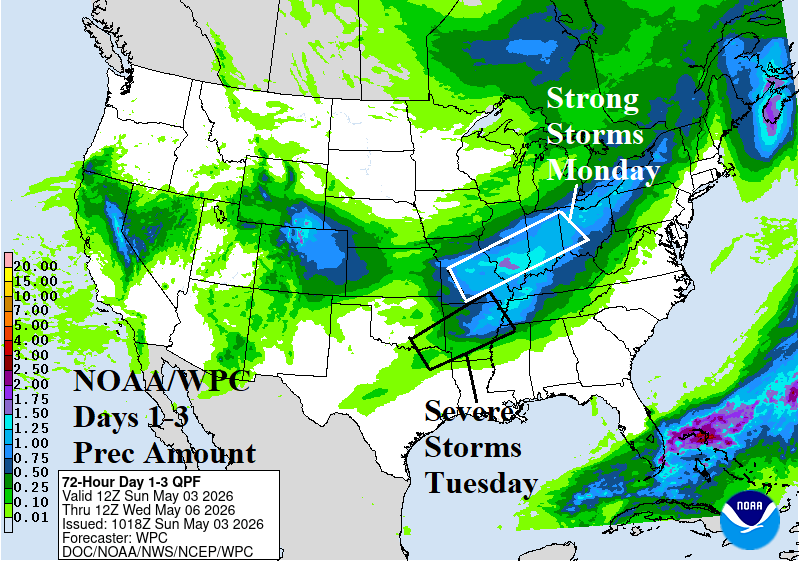
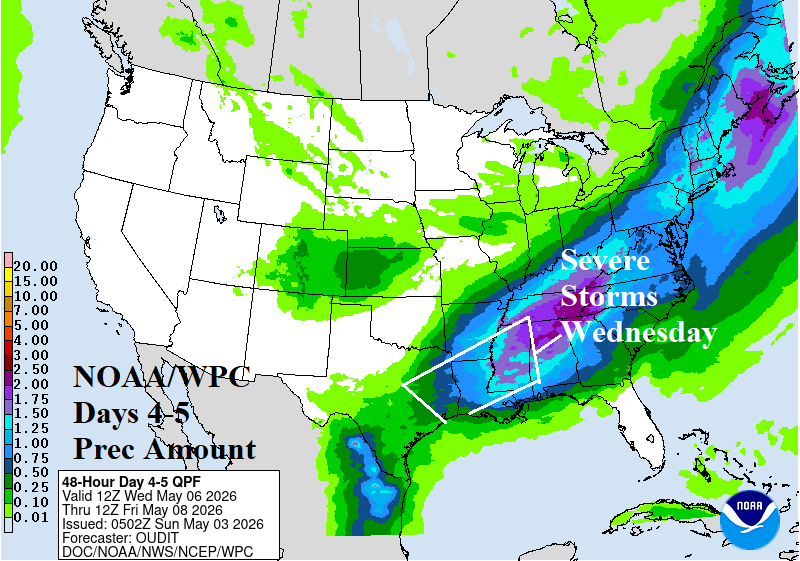
Fig. 2-3: NOAA/WPC 1-3-day and 4-5-day quantitative precipitation forecast with annotated severe weather risk areas.
Turning warmer in the East after a chilly weekend. Meanwhile, the next (strong) cold front rolls into the Midwest States tomorrow. The cold front triggers “strong” thunderstorms across the Midwest States later tomorrow and a severe weather outbreak across the Mid-south States on Tuesday (Fig. 2). By midweek, the frontal system causes a broad area of rain stretching from the Gulf States to New England including severe storms into the Tennessee Valley (Fig. 3). The cold front is off the East Coast Thursday night.
The ECM OP remains aggressive forecasting potential for widespread heavy rain from Texas to the Southern Ohio Valley later in the 6-10-day period (Fig. 4). ECM OP shifts the heavy rain risk to New England in the 11-15-day period (Fig. 5). Confidence is below average due to lack of consistent support from climate signals.
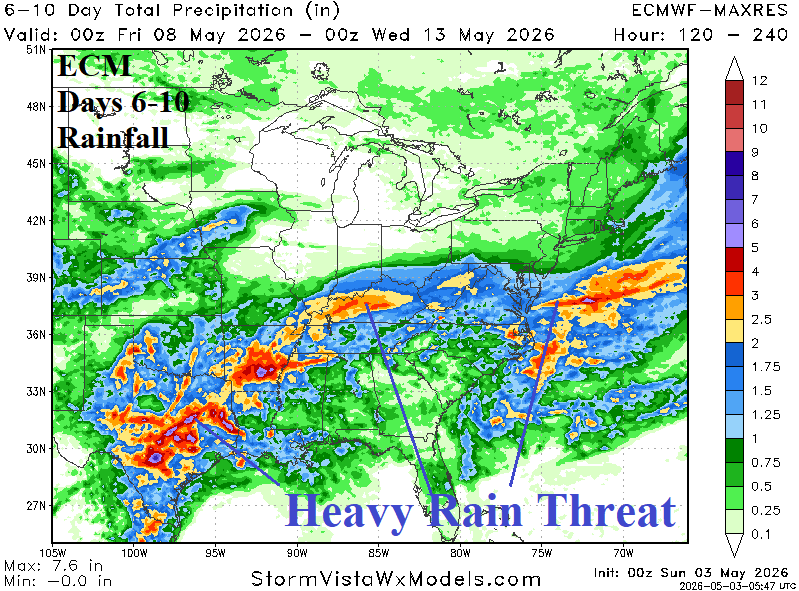
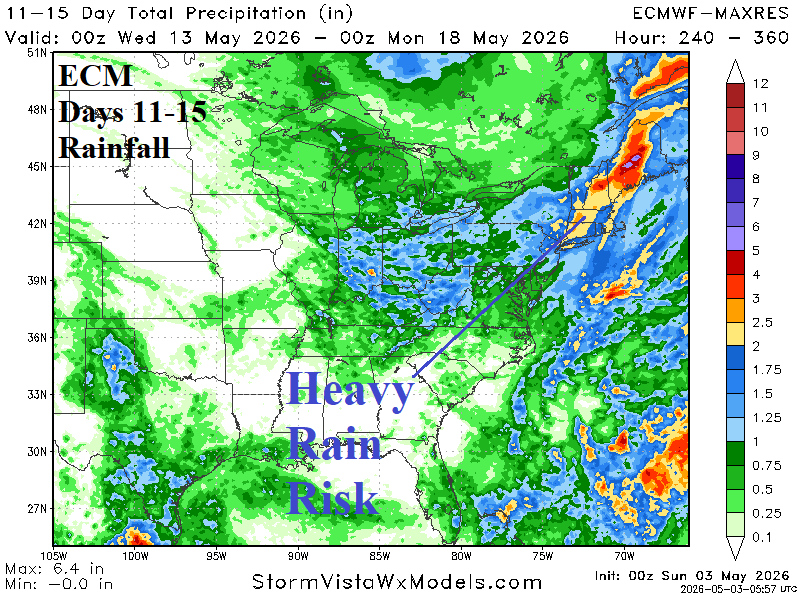
Fig. 4-5: ECM 6-10/11-15-day rainfall amount forecasts.
Finally, by May 15-21, U.S. population weight CDD projections pass HDD (Fig. 6-7). CDD forecasts indicated very limited early season cooling demand through next week shifting to near or slightly above the 10-year normal just after mid-May. A chilly start to May as late season heating demand is above normal through the first third of the month.
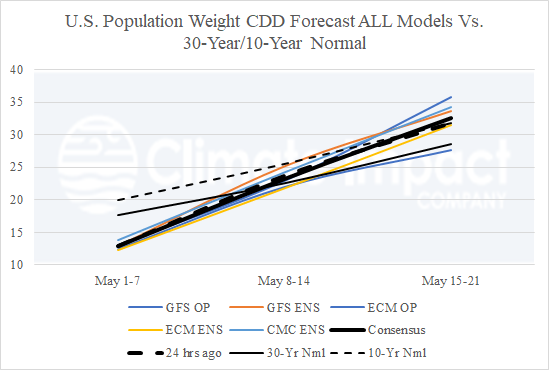
Fig. 6: U.S. population weight CDD forecast utilizing all models, their consensus, and comparison with 24 hours ago and 30-year/10-year climatology.
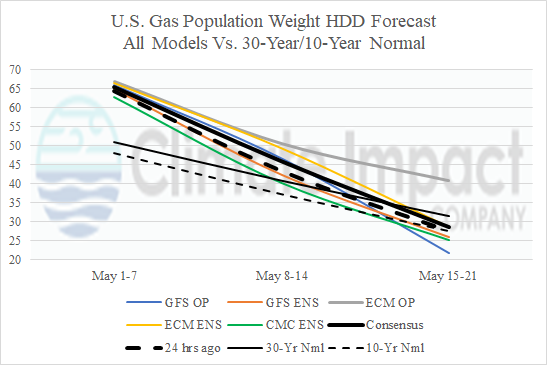
Fig. 7: U.S. gas population weight HDD forecast utilizing all models, their consensus, and comparison with 24 hours ago and 30-year/10-year climatology.
An interesting (and important) dilemma in the week-3 ahead outlook as ECM and AI Graph Cast (GC) maintain West U.S. warmth but GC keeps the Northeast cool (Fig. 8) while ECM warms the Tennessee Valley to the Mid-Atlantic region (Fig. 9), a forecast maintained into early June. Extended-range NAO forecasts indicate returning negative around the 22nd of the month. Therefore, the warmer ECM is supported early in the week-3 forecast followed by support for the cooler GC projection the second half of the week.
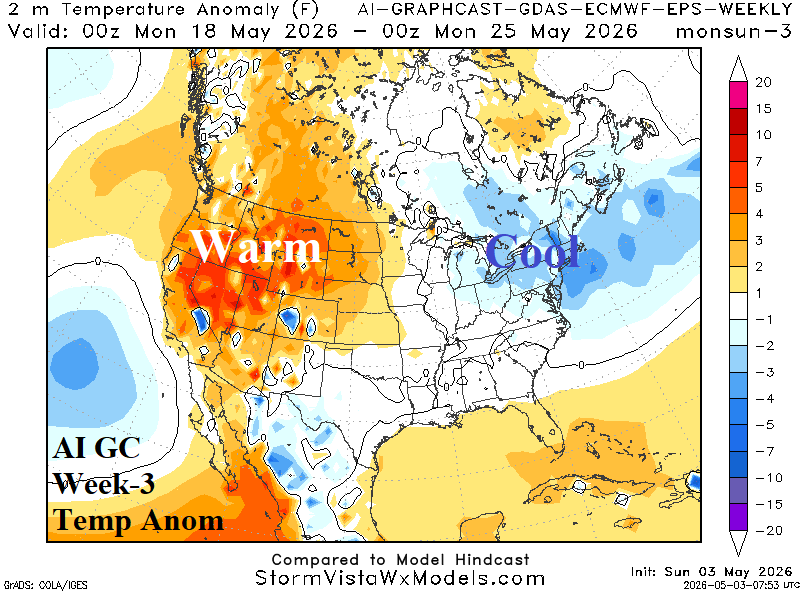
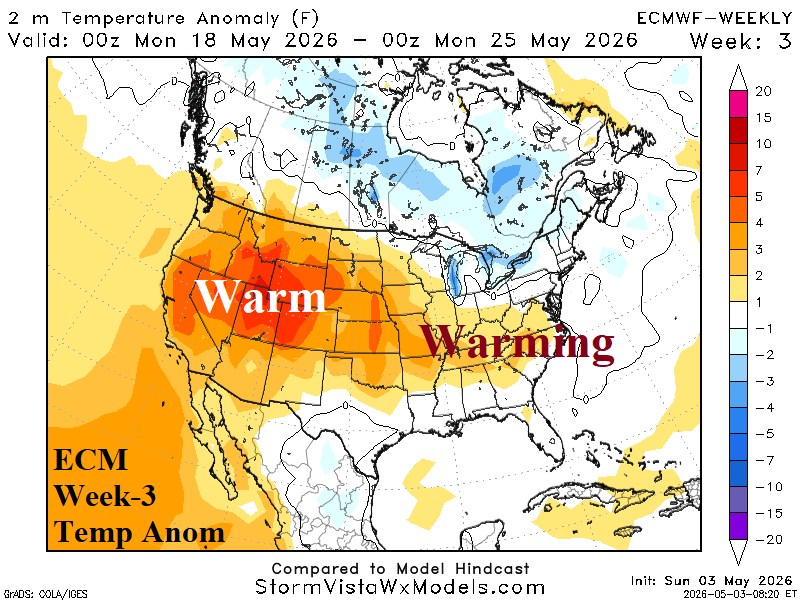
Fig. 8-9: AI Graph Cast and ECM week-3 temperature anomaly forecast for the U.S. indicating differences of opinion for the Northeast States.