The U.S. Precipitation Pattern Shifts Wetter
03/26/2026, 8:36 am EDT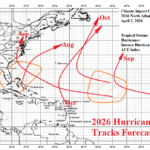
2026 North Atlantic Basin Tropical Cyclone Season Outlook
04/02/2026, 9:58 am EDT
![]()
Climate Impact Company Sunday Report
Issued: Sunday, March 29, 2026
Highlight: The largest U.S. climate problem as the warm season approaches? The Western U.S. Drought (and likely expansion)!
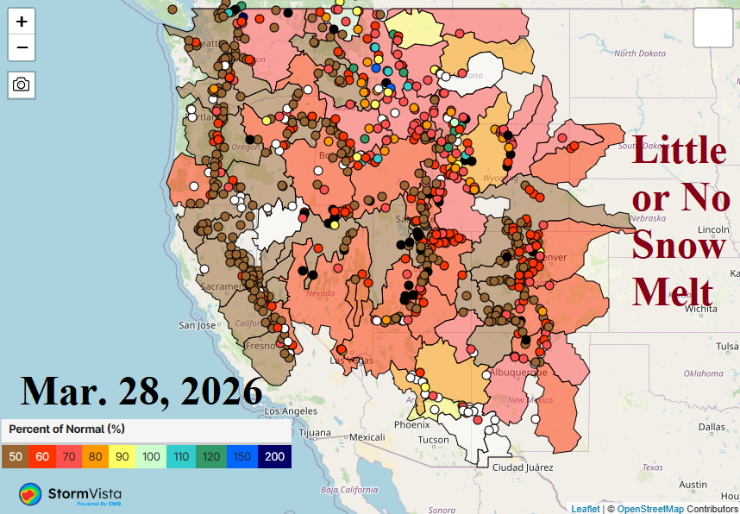
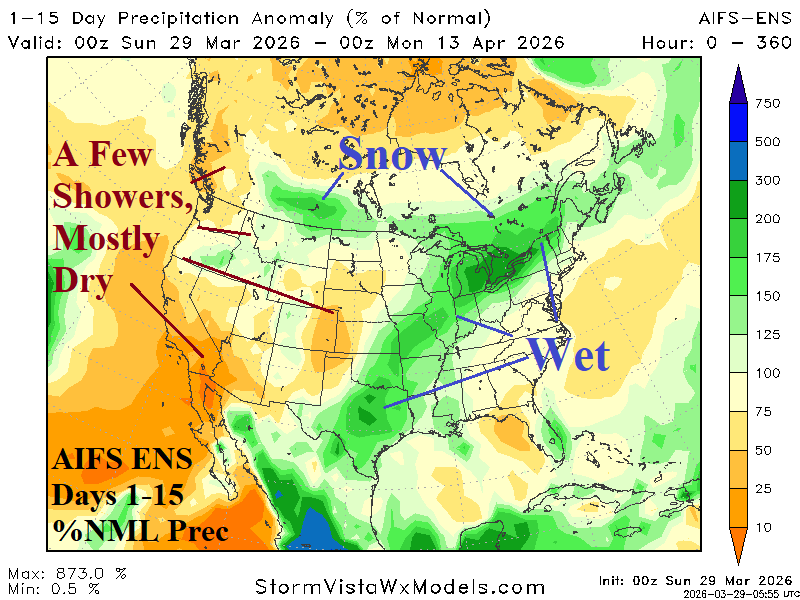
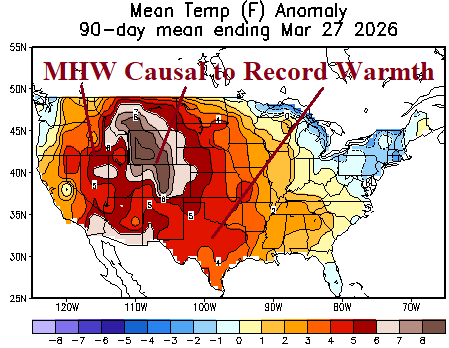
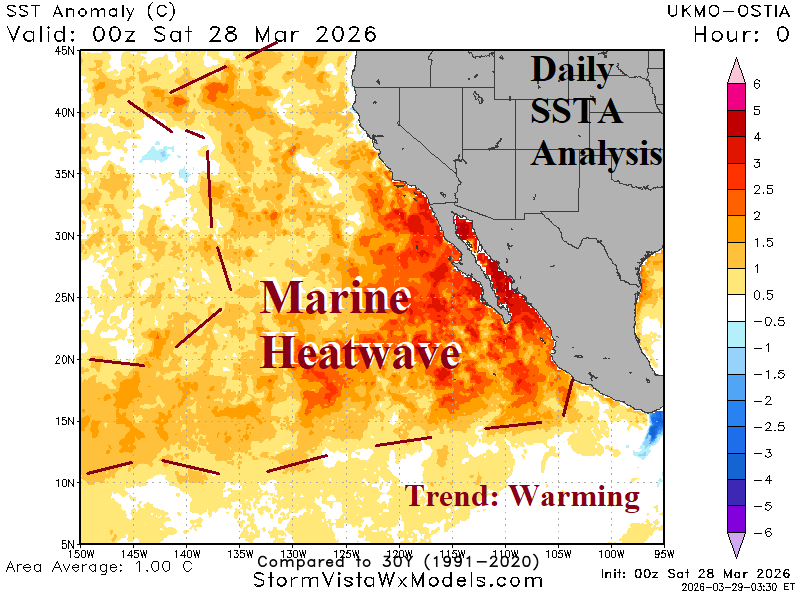
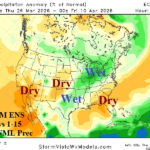
Fig. 1-4: Snow-water equivalent analysis for the West U.S., AIFS ENS percent of normal precipitation forecast, 90-day U.S. temperature anomalies, and the largest aerial coverage of a marine heatwave on record for the Northeast Pacific Ocean.
Discussion: Record low snowpack provides much below normal snowmelt and river inflows sustaining and intensifying a water supply drought across much of the West U.S. (Fig. 1). The intensified snow drought of winter 2026-27 and the attendant record warm temperatures (Fig. 2) was inspired by persistent intense high pressure ridging in the upper atmosphere across and downwind the highest aerial coverage of a marine heatwave (MHW) on record in the Northeast Pacific (Fig. 3). A wetter pattern in the U.S. is forecast for much of April. However, as indicated by the 15-day AIFS ENS percent of normal precipitation forecast (Fig. 4), a few showers in the Columbia/Great Basin surrounded by sustained dry weather for the remainder of the West is not helpful while most of the rain is in the East-central U.S. to Texas stretch. NOAA/CPC long-lead precipitation probability forecasts indicate the dry problem in the West accelerates during APR/MAY/JUN 2026 (Fig. 5). However, due to developing El Nino influences including effects on climate by the previously described MHW, a wet Southwest Monsoon is expected for JUL/AUG/SEP 2026 (Fig. 6). Given inclusion of the MHW influences, the Southwest U.S. rainfall could be prohibitive. Consequently, the 4-Corners Region drought ends during late warm season while continuing farther west in California and northward for the Northwest U.S. and Southwest Canada. Note that significant dryness appears in the Central Great Plains to Texas during Q3/2026.
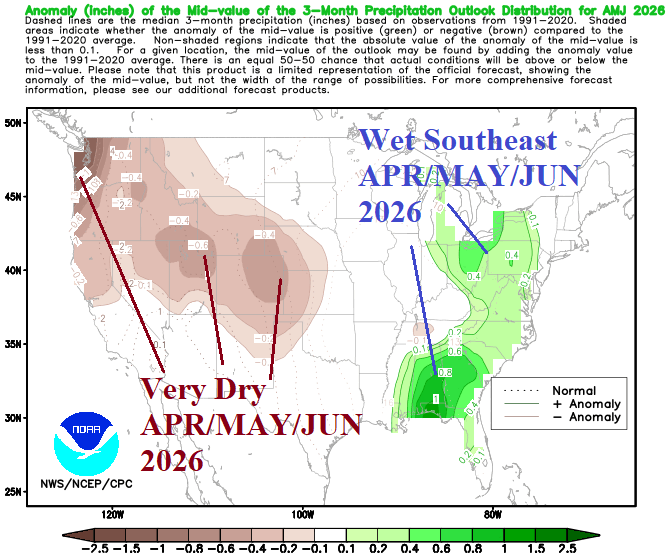
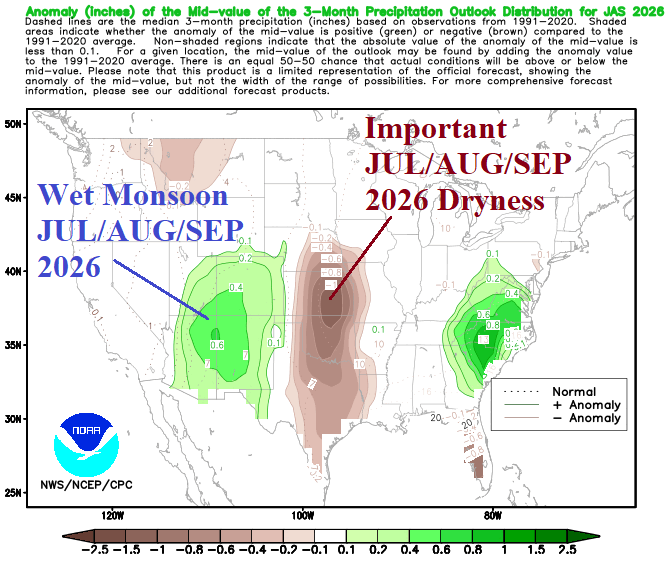
Fig. 5-6: NOAA/CPC long-lead precipitation probability climate forecasts for Q2 and Q3 of 2026.
Short-term issues include an unusual outbreak of strong thunderstorms featuring isolated hail and damaging wind across the same region on consecutive days (Fig. 7-8). A slow-moving cold front is responsible for the storms. The front shifts southward and stalls later this week and weekend causing an evolving wet pattern centered on the Mid-south U.S. (Fig. 9-10).
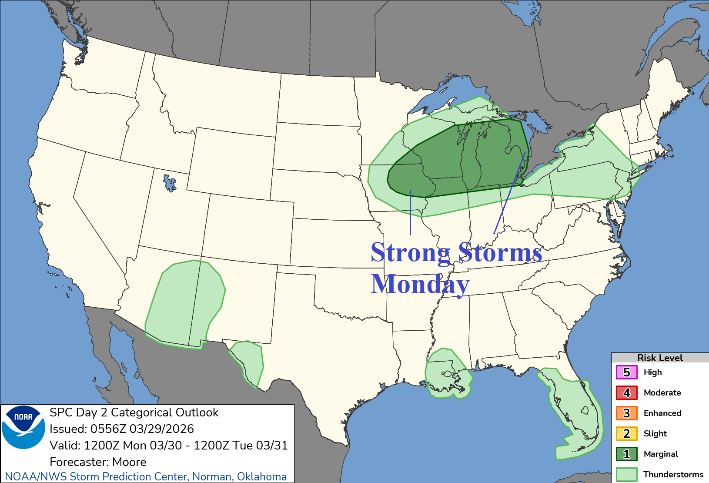
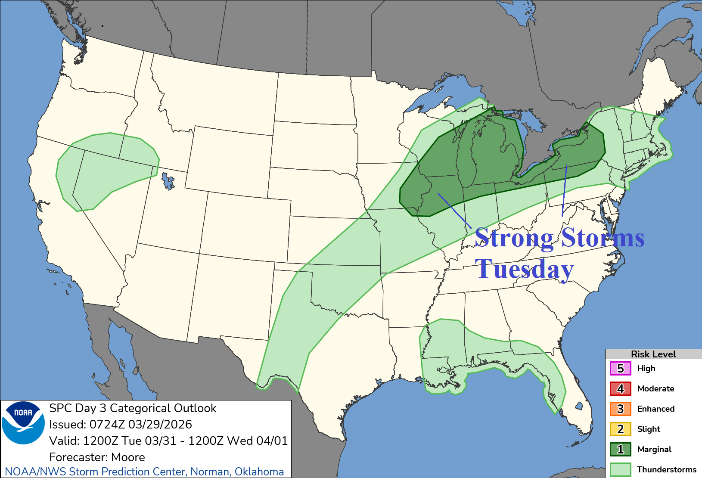
Fig. 7-8: NOAA/SPC outlook for strong thunderstorms stretched across the Great Lakes region tomorrow and Tuesday.
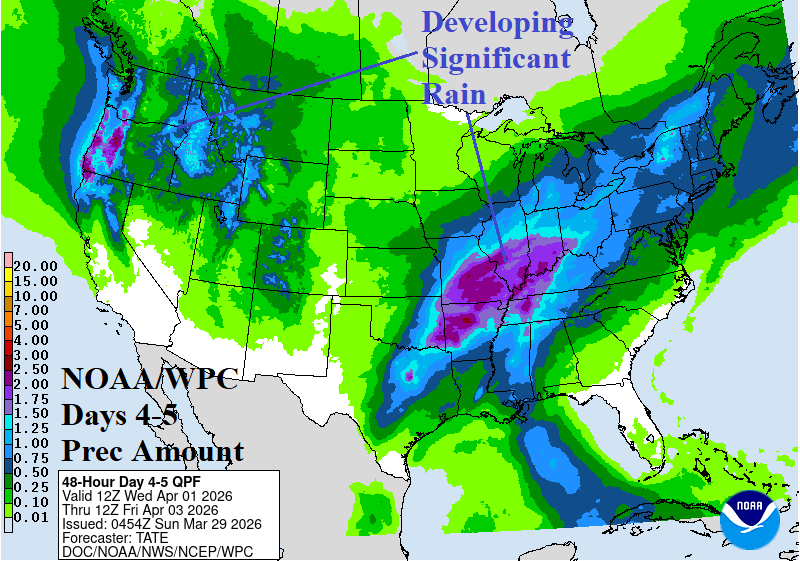
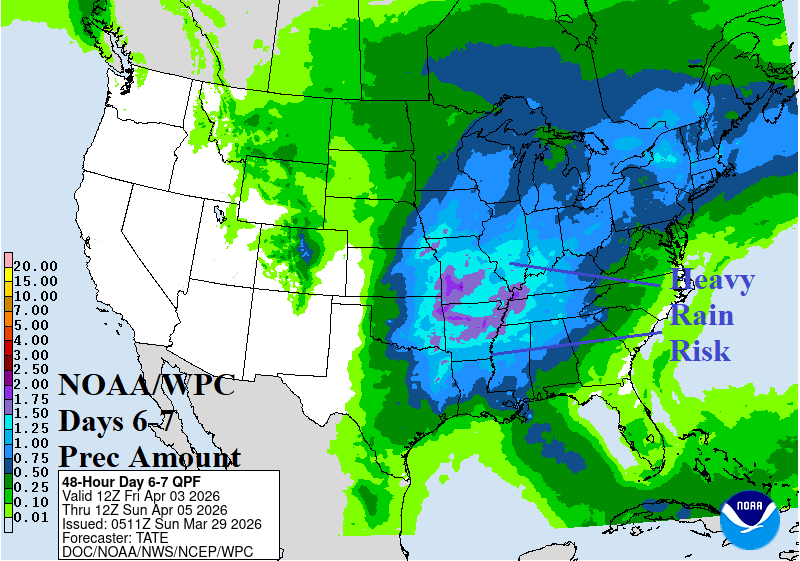
Fig. 9-10: NOAA/WPC quantitative precipitation forecasts (QPF) for WED/THU and SAT/SUN.
The U.S. gas population weight HDD forecast shifts warmer compared to 24 hours ago (Fig. 11). Note the very warm ECM forecast, which, as of late, has been too warm.
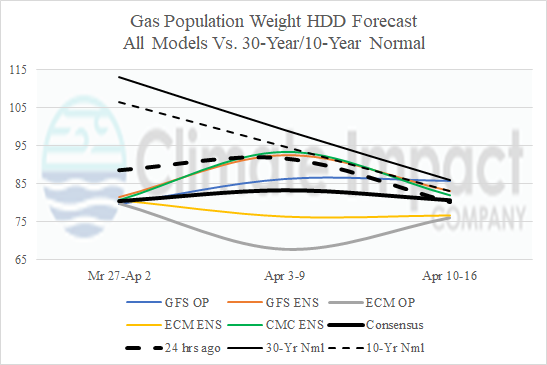
Fig. 11: U.S. gas population weight HDD forecast utilizing all models, their consensus, and comparison with 24 hours ago and 30-year/10-year climatology.