
Interior West/Northern U.S. and Florida are Windy Regions for Q1/2026
01/08/2026, 5:00 am EST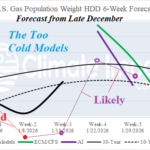
U.S. HDD Forecasts Have Been Too Cold
01/11/2026, 9:07 am EST
U.S. Soil Moisture Observations/Forecast Report
Issued: Friday January 9, 2026
Highlight: NW HYDRO & The Northeast Pacific “warm blob”; U.S. Drought Monitor, Latest EDDI, and CAS soil moisture outlook.
Executive summary: Historic warmth of the Northeast Pacific along the U.S. West Coast to Baja California is attributed to two climate patterns affecting NW/West HYDRO: 1.) Long duration dry high-pressure ridge (as expected during the next 3 weeks); 2.) Over-achieving precipitation producers as seen with the recent atmospheric river, a pattern that may return in February. 70% of the U.S. is affected by dry-to-drought conditions caused in-part by an 18-month La Nina climate as identified by multi-variate ENSO index. The outlooks for spring indicate significant drought potential for the southeast quadrant of the U.S.
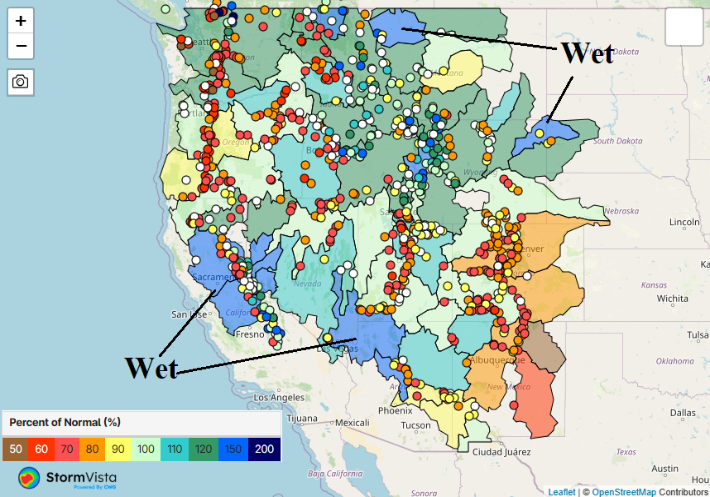

Fig. 1-2: The percent normal precipitation and snow-water equivalent for the Northwest/West HYDRO regions for early January.
Discussion: The recent “atmospheric river” pattern affecting the Northwest/West U.S. was an effective wet weather producer causing above normal precipitation for many sectors including the Northwest, Snake River Basin, and northern half of the Continental Divide plus the San Joaquin Valley and northwestern Arizona (Fig. 1). However, snow-to-water equivalent is mostly below normal (Fig. 2) as the AR pattern occurred mostly in milder than normal air. Causal to both the wet pattern and underachieving snowfall is anomalous warm ocean water along the U.S. West Coast to southwest of Baja California (Fig. 3-4). The warm sea surface temperature anomalies (SSTA) in this region rival the super warm observations of DEC/JAN 1997-98 El Nino and 2014-15 “warm blob”. The difference is waters west of the coastal warming during 1997-98 and 2014-15 were cool and characteristic of cool phase Pacific decadal oscillation (-PDO). In the modern climate, waters to the west are warmer than normal (and warming). The effect of the SSTA’s on Northwest HYDRO are wildly different. Warm SSTA are generally well-correlated to high pressure and we’re entering a period of high pressure drying out the West U.S. over the next several weeks. However, if the “atmospheric river” pattern returns, which is possible later in February, the warm SSTA causes over-achieving precipitation.
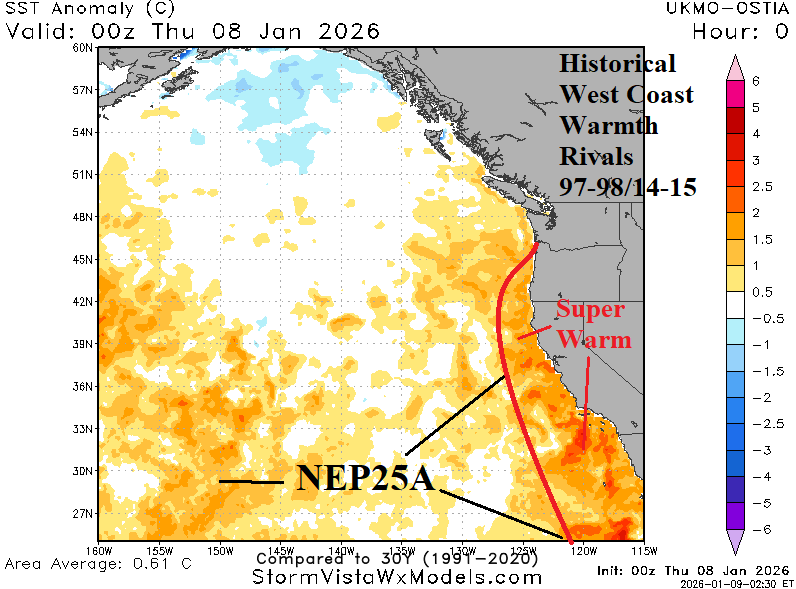
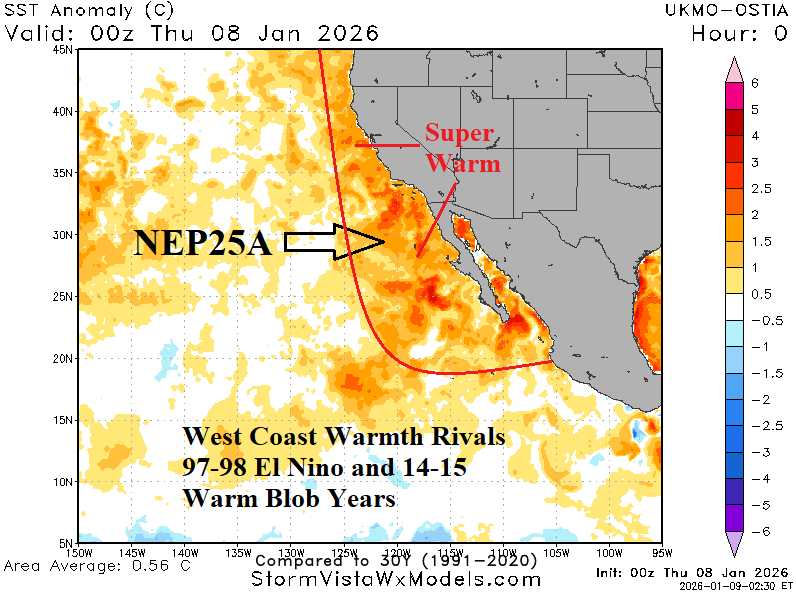
Fig. 3-4: Marine heatwave NEP25A was the strongest on record during SEP-25 in the Northeast Pacific and has shifted to the West Coast in recent weeks.

Fig. 5: U.S. Drought Monitor for the week ending January 6, 2026.
The latest U.S. Drought Monitor indicates plenty of dryness with dry-to-drought conditions affecting 70% of the nation (Fig. 5). The dryness is typical of a La Nina climate. Oceanic La Nina returned late last year but multivariate ENSO index (MEI) reveals La Nina climate present for the past 18 months (Fig. 6). Due to the lengthy La Nina climate, large areas of rapidly developing drought (or flash drought during the warm season) are identified by the latest evaporative drought demand index (EDDI) across the Great Basin to western Great Plains and Texas through the Mid-south U.S. and Ohio Valley (Fig. 7).
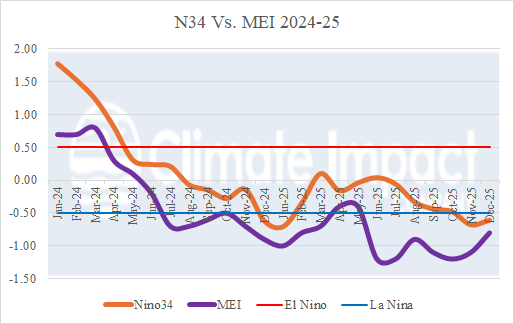
Fig. 6: Nino34 SSTA versus multivariate ENSO index for the past 2 years.
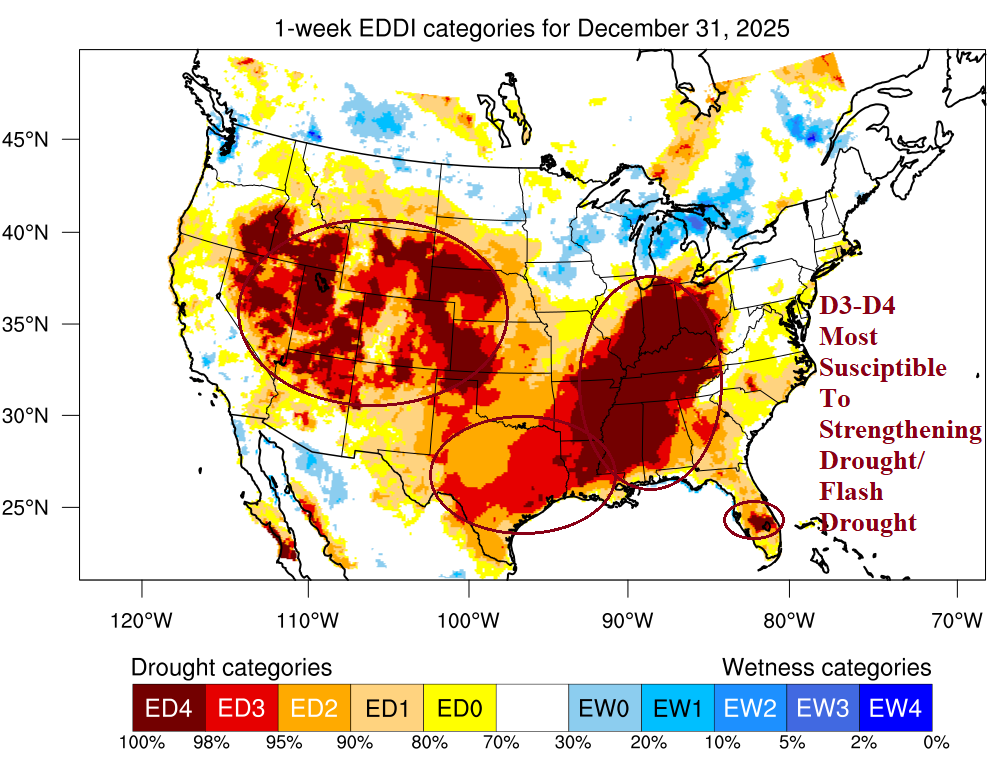
Fig. 7: Latest evaporative drought demand index for the U.S. valid 12/31/25.
U.S. soil moisture outlooks by SPI and CAS models are agreeable to a potential problem for the southeast quadrant of the U.S. including Texas and northward through the Mid-south and touching parts of the Midwest States (Fig. 8-9). Consensus suggests the most likely drought area for spring is Florida, most of the Southeast U.S., and East/South Texas.
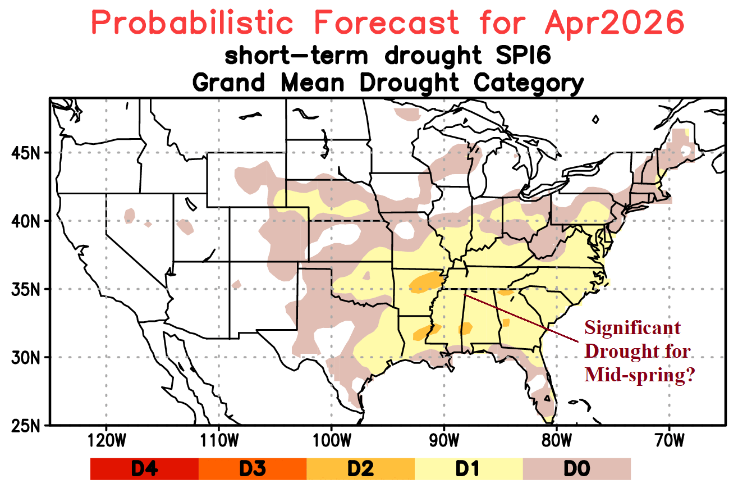
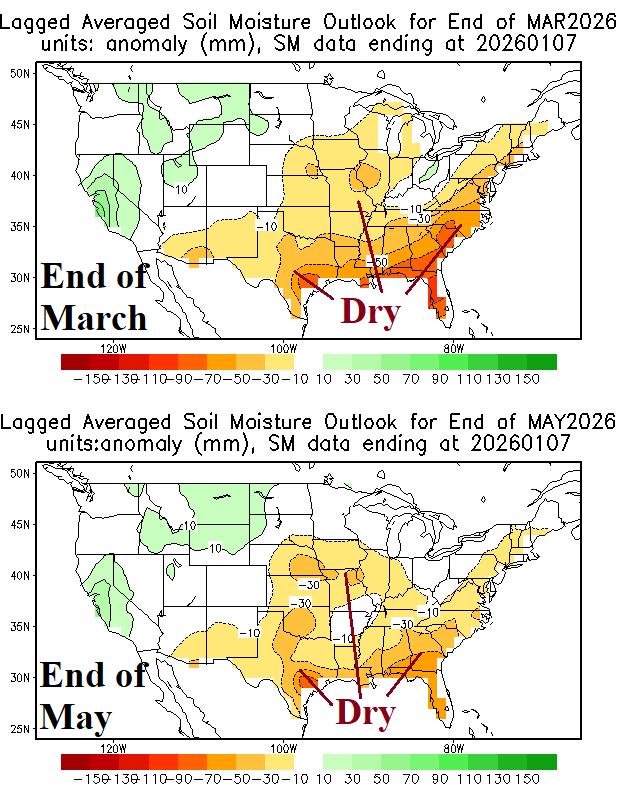
Fig. 8-9: NCEP SPI probabilistic soil moisture forecast for April 2026 and the NCEP CAS soil moisture anomaly outlook for the end of March and May 2026.