
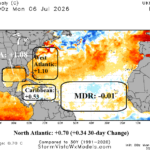
Updating North Atlantic SSTA Regimes
07/09/2026, 11:08 am EDT
Global Wind Oscillation Phase_7 Encourages -NAO Pattern To (Eventually) Cool East U.S./East Europe
07/14/2026, 8:27 am EDT
Climate Impact Company Gas/Power Report
Highlight: Latest U.S. CDD assessment for summer 2026.
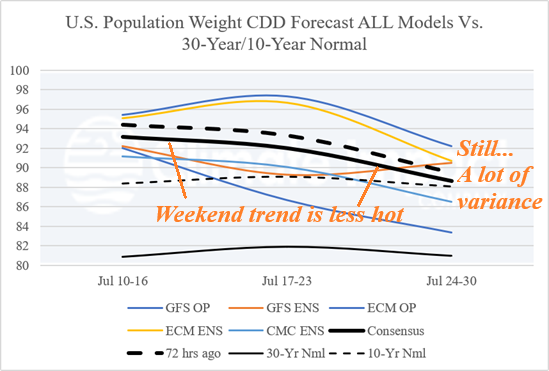
Fig. 1: U.S. population weight CDD forecast utilizing all models, their consensus, and comparing with yesterday and the 10-year/30-year normal.
Discussion: Natural gas prices have fallen from $3.35 to $2.90 since July 9th. A review of where we stand and where we’re going regarding U.S. population wight CDD is in order. The overnight U.S. population weight CDD forecast consensus is slightly less warm than Friday but remaining warmer than the 10-year climatology (Fig. 1). Note the wide range of opinions by operational models with ECM OP staying hottest and GFS OP maintaining the coolest forecast, a trend that started last week. So far, during meteorological summer 2026, weekly U.S. population weight CDD have shifted from a fluctuating character to steadily warmer than the 10-year normal and forecasts through August maintain near or above the 10-year normal (Fig. 2). The interesting (market) perspective is siding with cooler AI models in the longer range therefore the lower natural gas prices and doubting the hotter ECM (and CFS V2). Of course, the impact of CDD forecasts on the PJM sector is weighing heaviest. Maintained are the hotter ECM/CFS V2 vs. cooler AI forecasts in the latest weeks-ahead CDD projections (Fig. 3). Note that to date, warmer ECM national forecasts have verified. A big test through August is whether national CDD is as cool as AI claims. So far, meteorological Summer 2026 is not as hot as the past 2 years and forecast similar with 2024 for JUL/AUG (Fig. 4). The high visibility Mid-Atlantic population weight CDD forecast yields a hotter than past 2 years AUG/SEP forecast following the least hot (of the 3 years) JUN/JUL (Fig. 5).
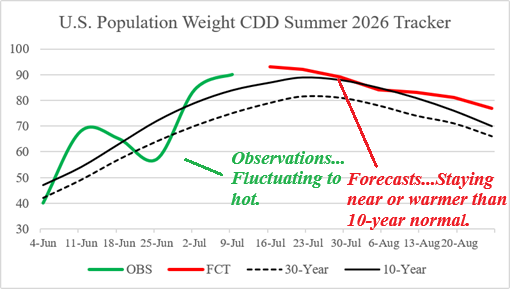
Fig. 2: Observed and forecast weekly U.S. population weight CDD for weeks of meteorological summer 2026.
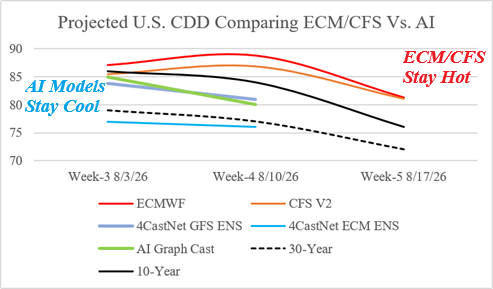
Fig. 3: Projected U.S. population weight CDD for week 3-5 ahead utilizing ECM, CFS V2, and 3 AI models.
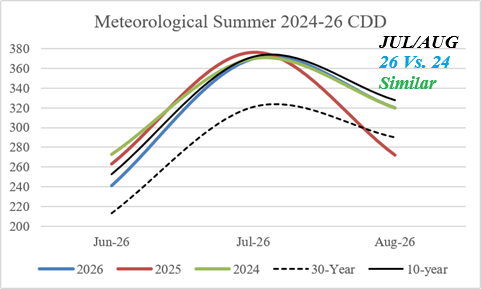
Fig. 4: The meteorological summer U.S. population weight CDD vs. 2025 and 2024.
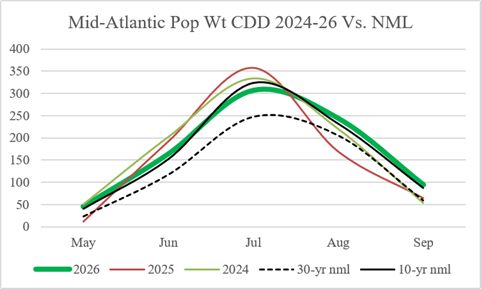
Fig. 5: The high visibility Mid-Atlantic regional CDD forecast for 2026 vs. 2025 and 2024.