
AG Traders/Analysts Understanding Rainfall Forecasts
06/29/2025, 10:12 am EDT
Another Marine Heatwave Induced Excessive Hot Weather Regime: East China/Japan
07/05/2025, 11:15 am EDT
Climate Impact Company Early U.S. Notes
Highlight: Flooding rainfall event Mid-Atlantic States today.
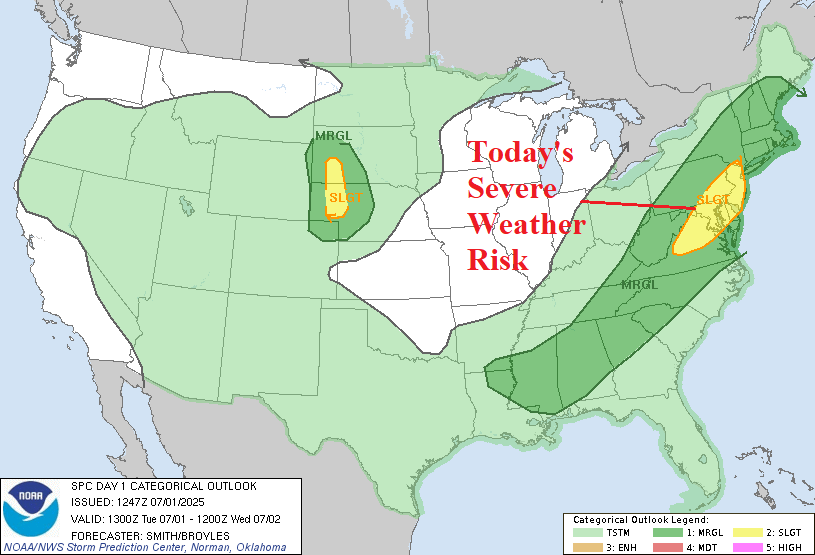
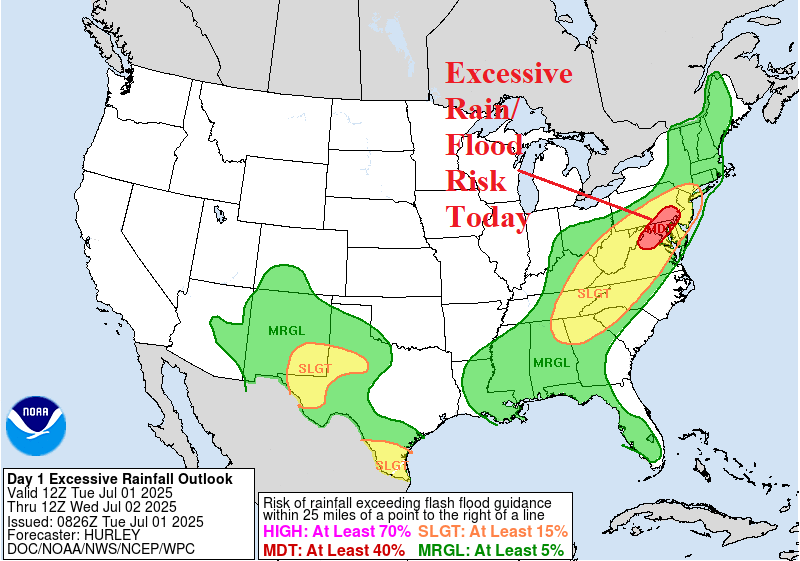
Fig. 1-2: The severe weather/excessive rain/flood risk forecast areas for today.
Discussion: NOAA/SPC projects strong thunderstorms across the East and Southeast U.S. for today (Fig. 1). Included is a severe weather risk caused by damaging wind potential in Virginia, Maryland, Delaware, Pennsylvania, and New Jersey. The event is lengthy, mid-afternoon to midnight, therefore repeat events can cause excessive rain and flooding most likely in the Washington/Baltimore area (Fig. 2). Today’s thunderstorms ease the PJM-East heat into the weekend with more heat returning next week (Fig. 3). The hot weather forecast for Texas, most focused on East Texas, remains in the 15-day outlook although the anomalous heat is cut back slightly (Fig. 4). The Europe heatwave eases in a few days (Fig. 5). However, the heat returns during the medium range. The U.S. population weight CDD forecast maintains above normal electricity demand through the next 2-3 weeks lowering to near normal later in the month (Fig. 6).
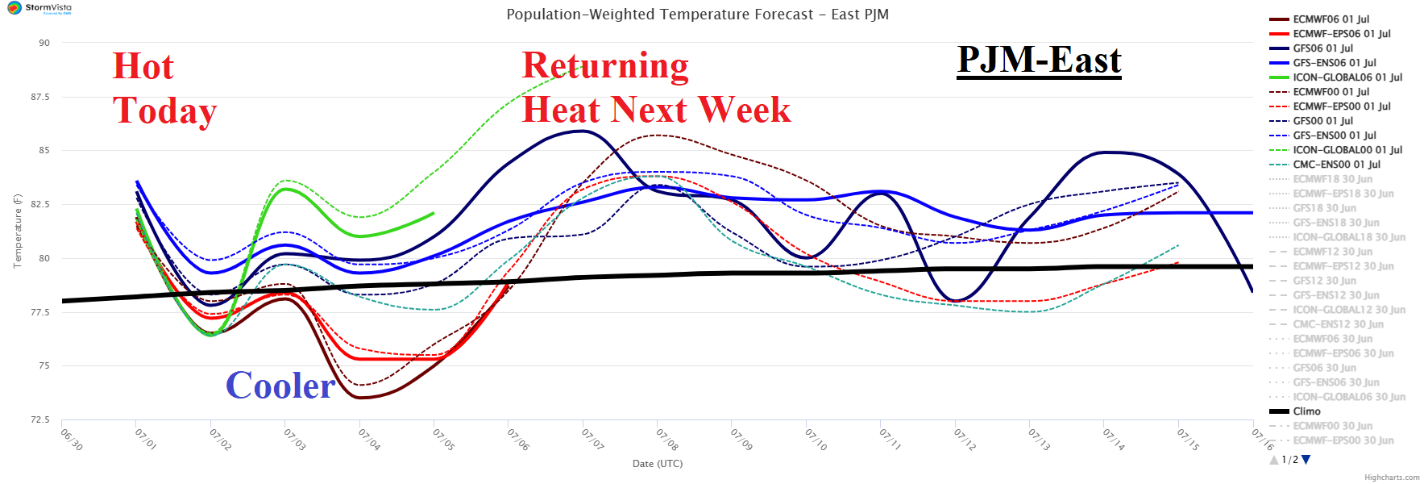
Fig. 3: The latest PJM-East System 15-day average temperature forecast using all models.

Fig. 4: The latest ERCOT System 15-day average temperature forecast using all models.

Fig. 5: The latest Europe System 15-day average temperature forecast using all models.

Fig. 6: The latest U.S. population weight 6-week CDD forecast.