Very Dry Brazil (Except Southeast) and Midwest U.S. Ahead
04/29/2026, 5:45 am EDT
A Dry Southern Canada MAY-JUL 2026 Forecast by Canadian Meteorological Center
05/01/2026, 8:45 am EDT
Climate Impact Company Early U.S. Notes
Issued: Thursday April 30, 2026
Highlight: Developing wet bias of forecast models, regional soil moisture and SSTA regimes begin to correlate with weather pattern as warm season arrives.
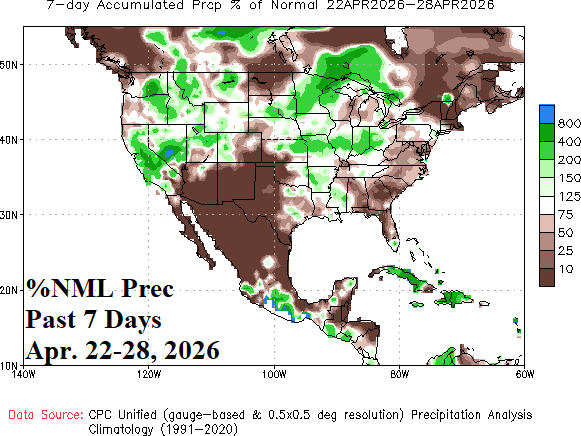
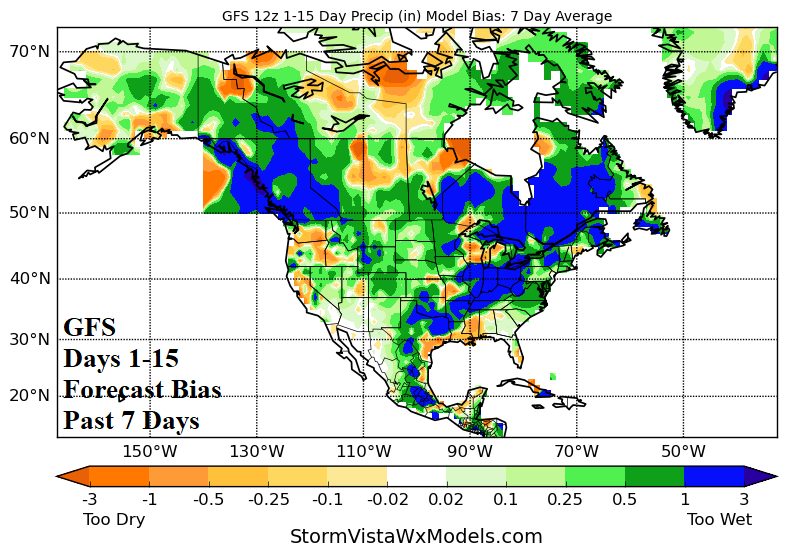
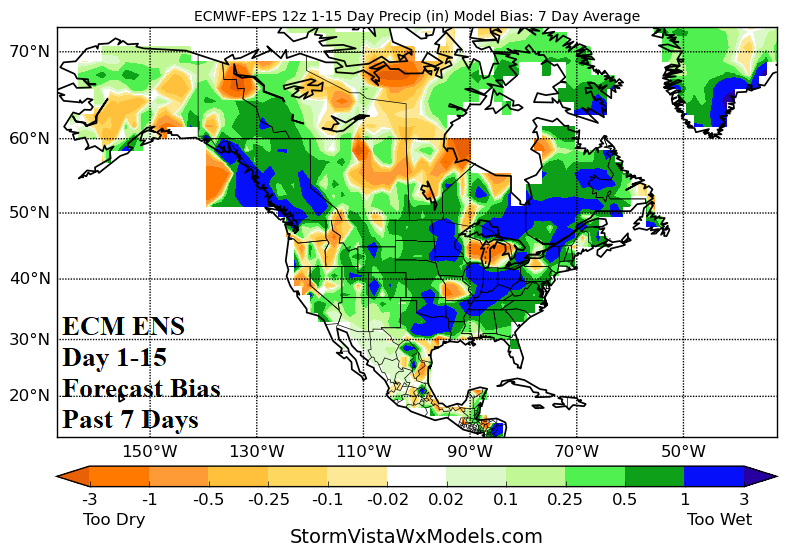
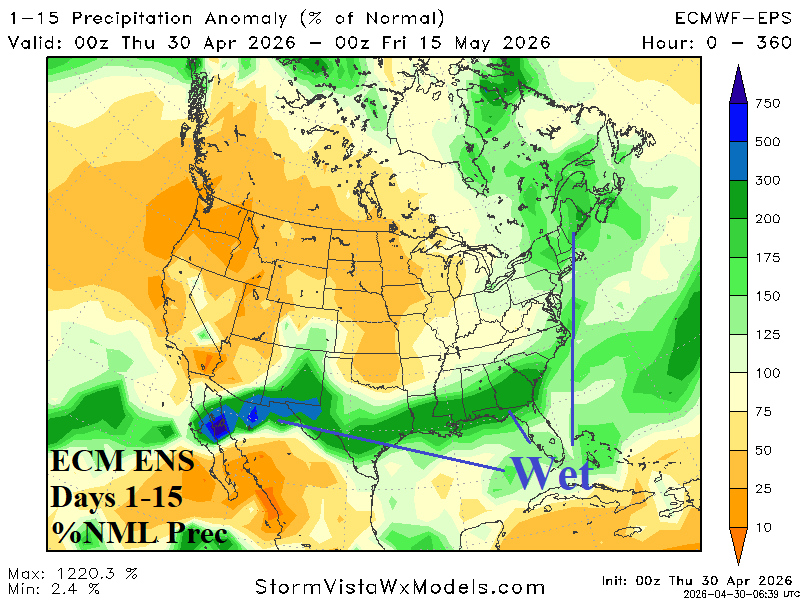
Fig. 1-4: Percent normal precipitation observed April 22-28, 2026, and the precipitation amount forecast bias during the past 7 days by GFS and ECM ENS plus the 15-day ECM ENS percent formal rainfall forecast for the U.S.
Discussion: During the past week, wet weather was observed in California to the Great Basin, Interior Northwest, and Midwest U.S. (Fig. 1). The GFS precipitation forecasts for this period are notably too wet in Southwest Canada (where no rain or snow occurred) and the Mid-south to Midwest and Northeast States (Fig. 2). The ECM ENS verification has a larger area of wet bias including the Southeast States and Great Plains (Fig. 3). The over-forecasting precipitation is an issue due to 76.5% of the U.S. currently affected by dry-to-drought conditions. The ECM ENS 15-day forecast pushes wet weather risk into the South and East States and based on recent forecast trends may be too wet (Fig. 4).
The 15-day upper air forecast by ECM ENS indicates an upper trough in the East with an upper ridge over the Northwest U.S. (Fig. 5). The climate pattern is correlated to the tendency for an upper ridge to gravitate toward a large drought region (Fig. 6) when nearby SSTA are much warmer than normal (Fig. 7). Conversely, a semi-permanent upper trough is attracted toward areas of wet soil and nearby cooling SSTA (Fig. 8). Soil moisture and SSTA regimes are slow to change and increase risk that the pattern indicated in the 15-day outlook can repeat.
The U.S. gas population weight HDD forecast continues to indicate above normal heating demand for early May with cooling demand below normal (Fig. 9).
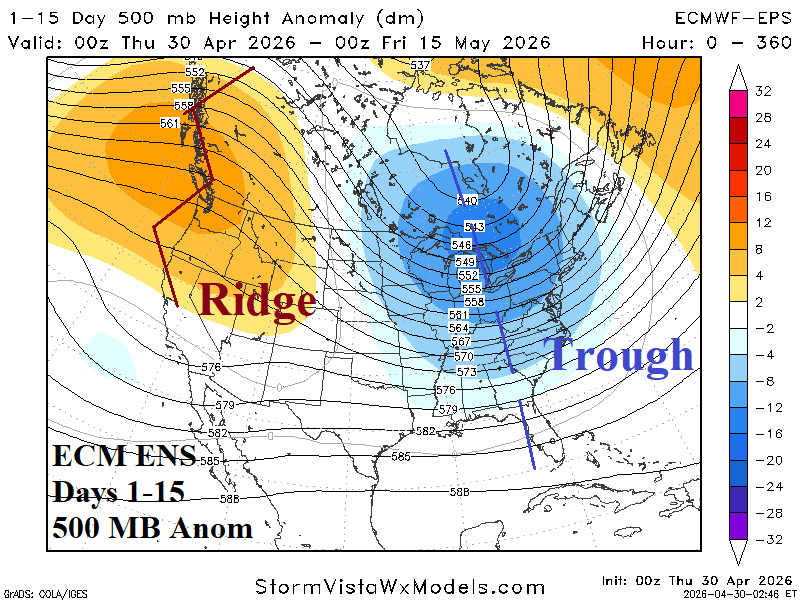
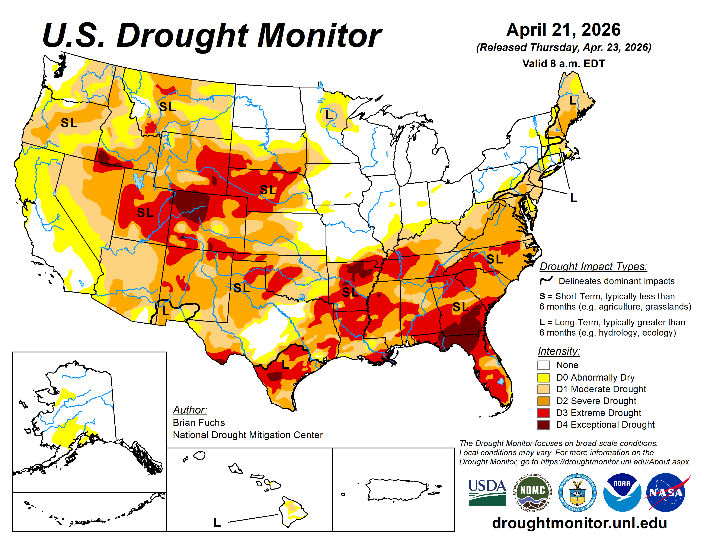
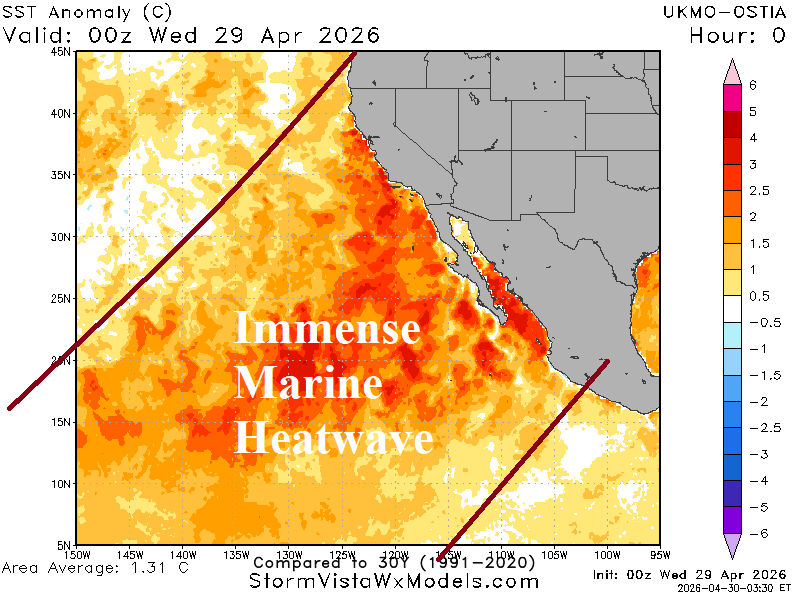
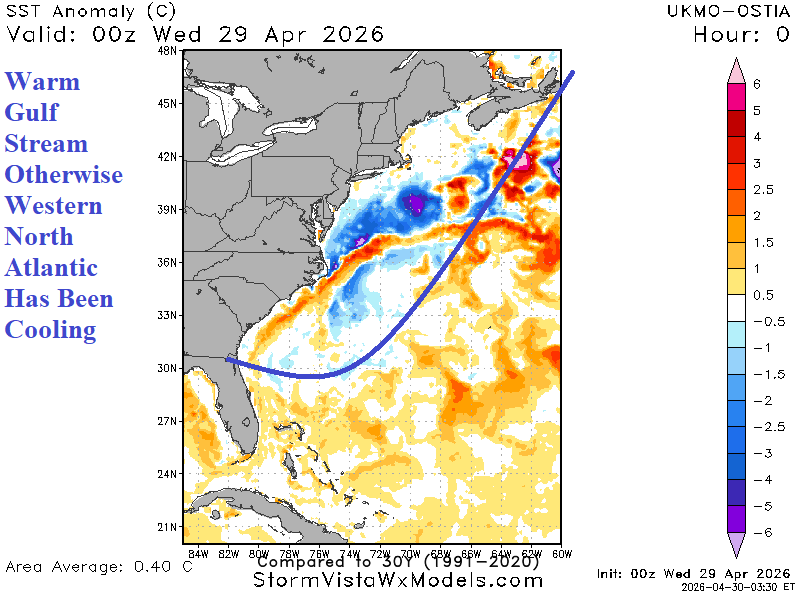
Fig. 5-8: The ECM ENS 15-day 500 MB anomaly forecast for North America, U.S. Drought Monitor, and Southwest Pacific/West North Atlantic daily SSTA observations.
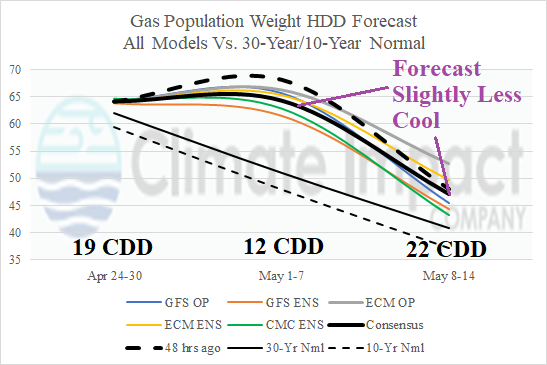
Fig. 9: The latest U.S. gas population weight HDD forecast maintains above normal late season heating demand.