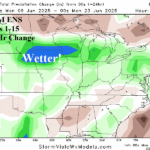
Shifting Wetter U.S. Corn Belt in Medium-range Forecasts
06/09/2025, 4:00 am EDT
Hot and Dry Pattern Ahead for Europe; Drought Expansion Southward!
06/11/2025, 4:44 am EDT
Climate Impact Company U.S. Daily Report
Highlight: Second warmest meteorological spring on record!
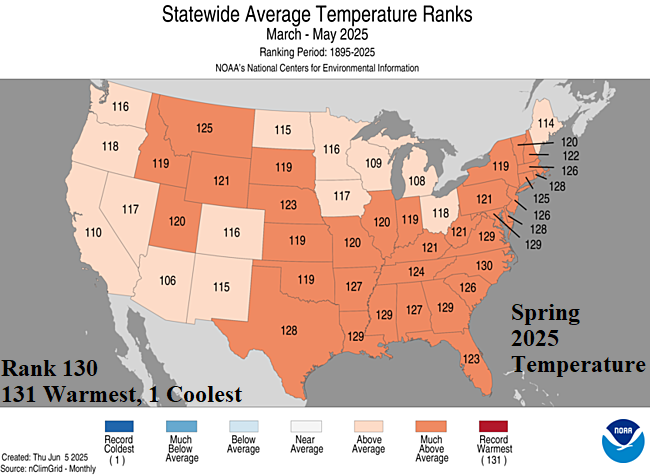
Fig. 1: The NOAA state rankings for temperature observed during meteorological spring (MAR/APR/MAY) 2025 based on the 131-year climatology.
Discussion: Meteorological spring 2025 was the second warmest on record (Fig. 1). Thirty-three states observed MUCH ABOVE normal temperature with 12 states recording an all-time top 5 warmest springtime on record. North Carolina finished 2nd warmest on record. Wet climate was observed across the Central and East U.S. during MAR/APR/MAY 2025 and the nation ranked 24th wettest of 131 years of climatology. The wettest state rankings included all the New England States (except Connecticut) plus Kentucky and Oklahoma (Fig. 2). The month of May 2025 was the 26th warmest on record with Florida observing their 2nd warmest late spring on record (Fig. 3). California finished May in the MUCH ABOVE normal category. May 2025 rainfall was 13th wettest on record lead by record breaking rain in Alabama and top 5 all-time wet months of May for 9 eastern states (Fig. 4).

Fig. 2: The NOAA state rankings for precipitation observed during meteorological spring (MAR/APR/MAY) 2025 based on the 131-year climatology.
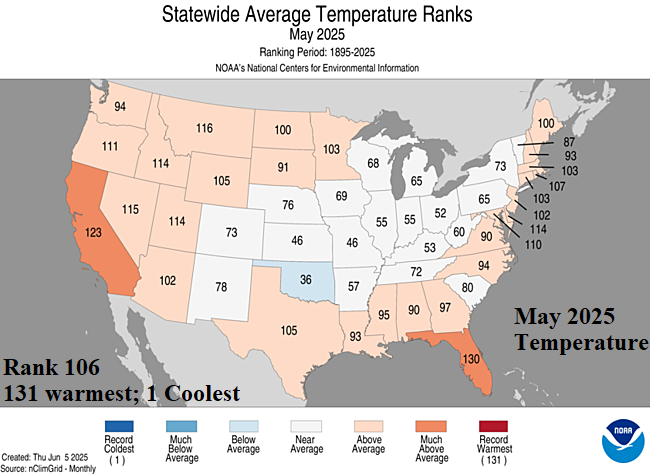
Fig. 3: The NOAA state rankings for temperature observed during May 2025 based on the 131-year climatology.

Fig. 4: The NOAA state rankings for precipitation observed during May 2025 based on the 131-year climatology.