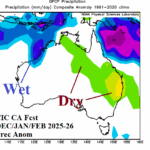
Surprising Drier Change Eastern Australia Latest Summer 2025-26 Outlook
11/28/2025, 5:25 am EST
Dynamic/AI Models Verification Report: AIFS skill scores are best for medium range North America/Europe temperature forecasts; Ongoing wet bias in Brazil.
12/04/2025, 4:51 am EST![]()
Climate Impact Company 2025 North Atlantic Basin Review and Initial 2026 Forecast
Issued: Monday December 1, 2025
Highlight: Compared to recent history, the 2025 season was less bothersome than normal to the U.S. The preliminary outlook for 2026 is similarly active to 2025 despite presence of El Nino.
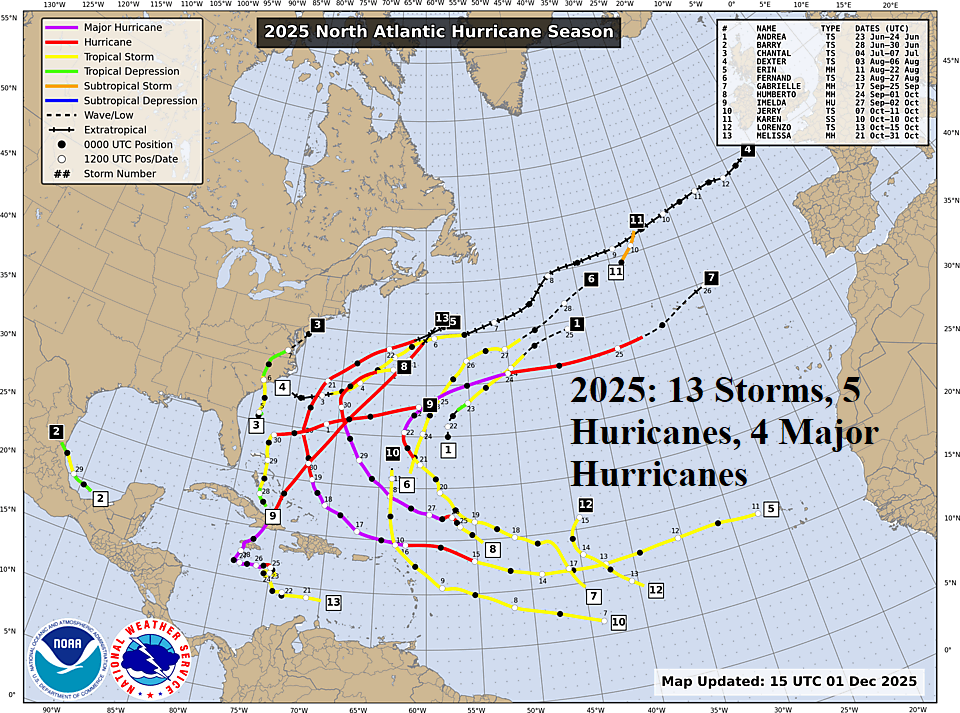
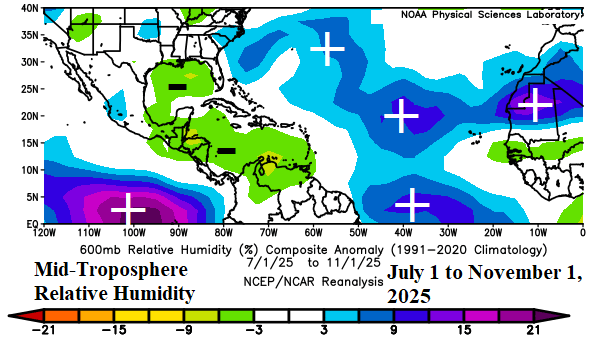
Fig. 1-2: The 2025 tropical cyclone tracks across the North Atlantic basin and mid-troposphere relative humidity observations for July 1 to November 1, 2025.
The observed 2025 season discussion: The 2025 North Atlantic basin tropical cyclone season featured extremes including lack of activity in the Gulf of Mexico, no hurricane strikes to the U.S., and 4 major hurricanes tracking northward in the west-central basin (Fig. 1). The seasonal tracks were remarkably similar, mostly forming in the deep tropics or subtropics east of the Bahamas and turning north passing close by or directly over Bermuda. The mid-troposphere relative humidity (RH) depicts the environment supportive for development (Fig. 2), in the eastern tropical Pacific and central tropics and subtropics of the North Atlantic while in between, dry air suppressed activity in the Gulf of Mexico and Caribbean Sea (until late season).
The seasonal activity totaled 13 tropical storms, 5 hurricanes, and 4 intense hurricanes (Table 1). The seasonal accumulated cyclone energy (ACE) index was 132.6. Observed amounts are below the 30-year normal and well below the 9-year active period normal. The exceptions are major hurricanes and ACE index which were near-to-slightly above normal. The 2025 North Atlantic basin tropical cyclone season forecasts by Climate Impact Company were slightly too active (Table 2). Similarly, the Colorado State University, Tropical Storm Risk/U.K., and NOAA/NHC seasonal forecasts were slightly too active (Table 3). The Climate Impact Company hurricane tracks forecast was reasonable except for 1 track in the western Gulf and 1 track in the outer Atlantic (Fig. 3-4).
| Tropical Storms | Hurricanes | Intense Hurricanes | ACE Index | |
| 2025 | 13 | 5 | 4 | 132.6 |
| 1991-2020 | 14.4 | 7.2 | 3.2 | 122.1 |
| 1995-2024 | 15.9 | 7.8 | 3.5 | 134.8 |
| 2016-2024 | 18.8 | 8.6 | 3.9 | 151.1 |
Table 1: The 2025 North Atlantic basin seasonal tropical cyclone activity compared to 30-year normal and the 2016-24 active period.
| Tropical Storms | Hurricanes | Intense Hurricanes | ACE Index | |
| CIC Latest | 16 | 7 | 4 | 135 |
| CIC Initial | 17 | 7 | 5 | 137 |
Table 2: The early season and just before peak of season North Atlantic basin tropical cyclone activity forecast by Climate Impact Company.
| Tropical Storms | Hurricanes | Intense Hurricanes | ACE Index | |
| CSU Latest | 16 | 8 | 3 | 150 |
| CSU Initial | 17 | 9 | 4 | 155 |
| TSR Latest | 16 | 8 | 3 | 144 |
| TSR Initial | 14 | 7 | 3 | 120 |
| NOAA | 13-19 | 6-10 | 3-5 | 120-160 |
Table 3: The early season and just before peak of season North Atlantic basin tropical cyclone activity forecast by Colorado State University, Tropical Storm Risk/U.K., and NOAA/NHC.
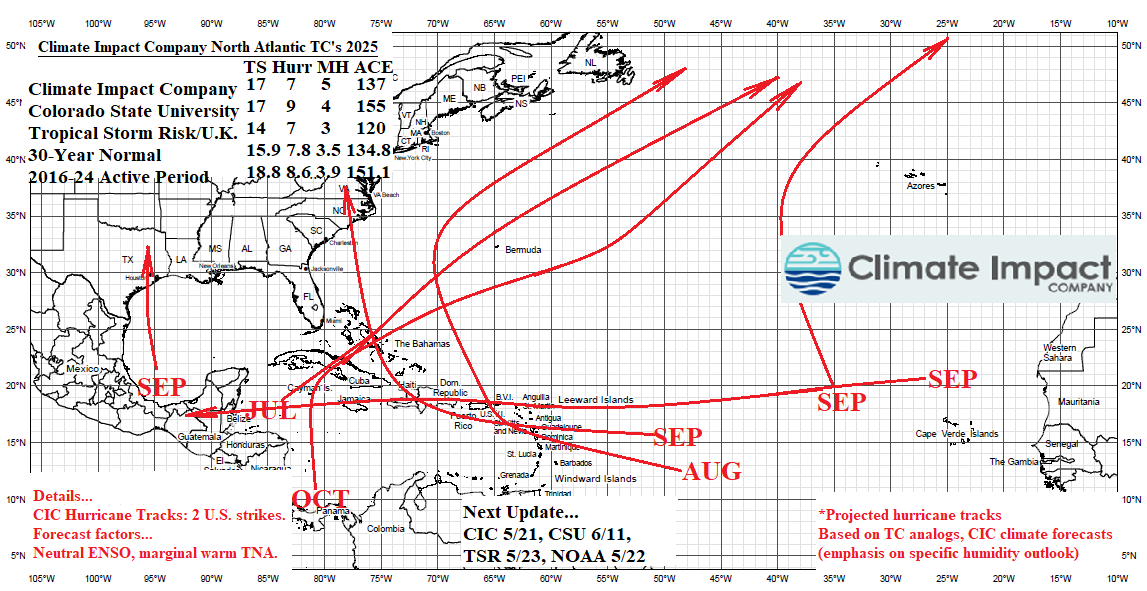

Fig. 3-4: The Climate Impact Company North Atlantic basin hurricane tracks forecast issued last spring compared to observed tracks.
The 2026 season initial outlook: The preliminary outlook for tropical cyclone season activity during 2026 for the North Atlantic basin is based on a reasonable risk of El Nino and continued anomalous warming of the North Atlantic basin although the deep tropics are closer to normal SSTA (Fig. 5). Based on evolution of El Nino during the tropical cyclone season while mid-latitude SSTA were very warm, analog years include 2004/2009 for a weaker El Nino and 2015/2023 for a stronger El Nino. The preliminary forecast range for 2026 activity is 12-16 tropical storms, about 6 hurricanes, and 3-4 intense hurricanes and 105-140 ACE index (Table 4). The activity level is similar with 2025, slightly below the 30-year normal, and much below the 2016-24 active period climatology. The range in U.S. coastal strikes of tropical cyclones for the analog years ranges widely from 2 to 7.

Fig. 5: The Climate Impact Company North Atlantic basin hurricane tracks forecast issued last spring compared to observed tracks.
| Tropical Storms | Hurricanes | Intense Hurricanes | ACE Index | |
| 2004/2009 | 12 | 6 | 4 | 140 |
| 2015/2023 | 16 | 6 | 3 | 105 |
| 30-Year NML | 15.9 | 7.8 | 3.5 | 134.8 |
| 2016-24 | 18.8 | 8.6 | 3.9 | 151.1 |
Table 4: The preliminary range of tropical cyclone activity forecast for the 2026 season compared to normal.