NOAA/CPC Winter 2025-26 Outlook is Edging Colder/Snowier
10/16/2025, 9:08 am EDT
Cool Air Masses South America; Brazil Rains 1st Week of November
10/21/2025, 5:30 am EDT
Climate Impact Company Madden Julian Oscillation Outlook
Issued: Monday, October 20, 2025
Highlight: Moderate intensity MJO affects Australia/South America rainfall patterns. Increased tropical cyclones Indian/West Pacific basins.
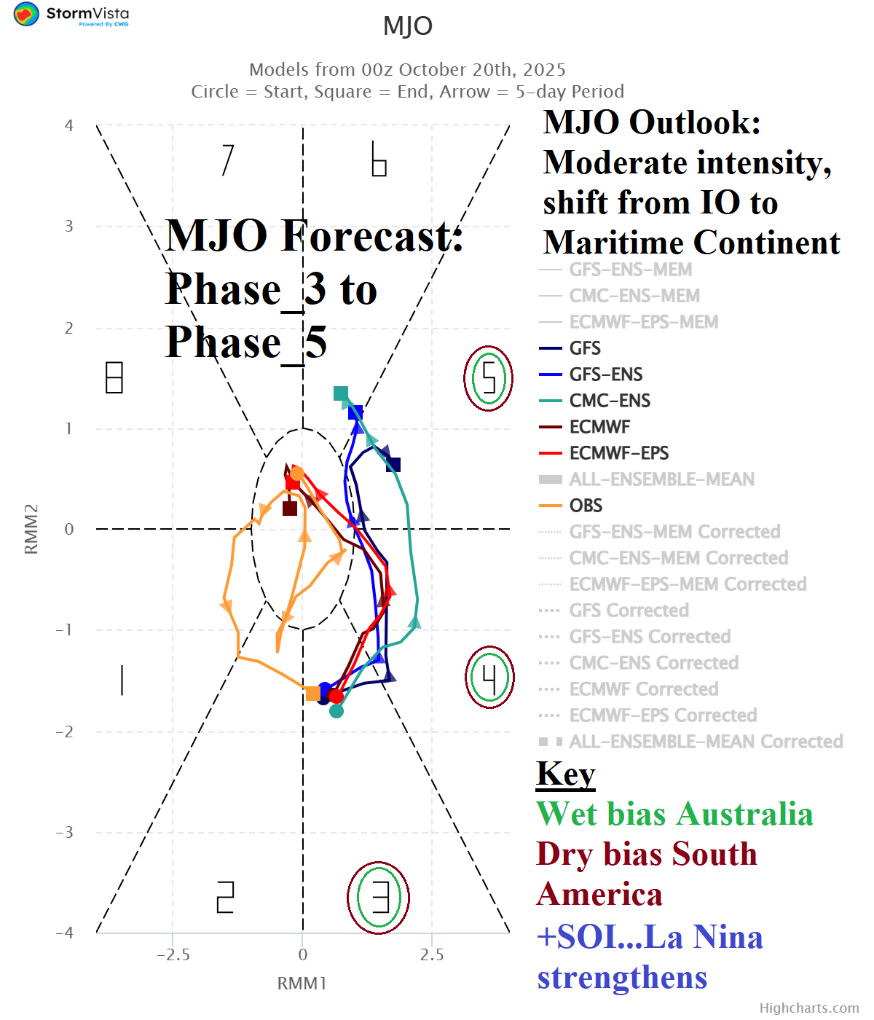
Fig. 1: The MJO 2-week forecast reveals moderate intensity shifting from the Indian Ocean (phase_3) to Maritime Continent (phase_5).
Discussion: The Madden Julian oscillation (MJO) remains active. The eastward shifting MJO in the tropical Indian Ocean (phase_3) to the Maritime Continent (phase_5) over the next 2 weeks will influence climate Australia and South America plus the West Pacific tropics to the U.S. In Australia, spring has been unexpectedly hot and dry. However, the MJO shift identified produces a wetter regime in Australia and 15-day outlooks identify wet scenarios on the South and West Coast (Fig. 2). Additionally, the extreme heat is chopped down in the 6-10-day period (Fig. 3). In South America, the MJO shift supports a drier weather pattern. In the West Pacific and Indian Ocean, an active tropical cyclone regime is produced with at least 2 or 3 systems likely for each basin in the next 15 days. The influence on the U.S. is a transitional pattern averaging cooler than the recent very warm outlooks. Additionally, southern oscillation index (SOI) is sustained in the positive phase suggesting increased trade winds and up-welling in the eastern equatorial Pacific as La Nina intensity increases.
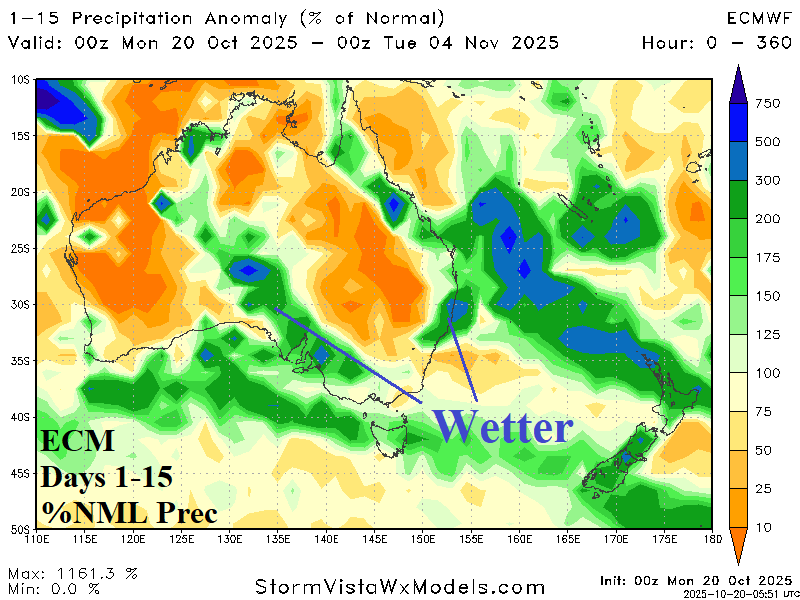

Fig. 2-3: The MJO effect on Australia weather features increased wet risk and a breakdown of the heatwave in the 6-10-day period.