
Searing Heat and Dryness in Australia Forecast to Fade
10/26/2025, 12:13 pm EDT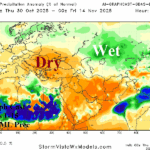
Black Sea Region Was Wet in October Reverses Dry in November
10/30/2025, 4:42 am EDT
Climate Impact Company Early AG Market ALERT
Issued: Wednesday October 29, 2025
Highlight: Deciphering South America weather.
Discussion: A review of the OCT-25 precipitation climate across South America so far reveals a drier than normal regime across Central to Southeast Brazil (Fig. 1) which justifies ongoing below normal soil moisture observations from NOAA (Fig. 2). Argentina has been mixed yielding mostly normal to wetter than normal soil conditions.
The 15-day outlook is wetter than normal across Paraguay and the southern half of Brazil which includes most of the dry soil region (Fig. 3). To compensate for Brazil rains, Eastern Argentina is left drier than normal. The wet weather is attributed to influence of a persistent upper-level low-pressure trough pattern extending across Northern Argentina and eastward (Fig. 4).
The upper trough is characteristic of an unseasonably strong negative phase of the Antarctic Oscillation (Fig. 5) which implies leftover winter-time polar influences on South America rainfall (rather than monsoon onset).
Interestingly, -AAO is forecast to weaken after 10 days suggesting wet forecasts in Brazil in the 16-30-day period by both ECMWF and AI Graph Cast are purely monsoon-oriented (Fig. 6-7).
Once into the warm season, convective rains persisting across Brazil imply compensating atmospheric subsidence north and south of the thunderstorm activity leaving Northeast Argentina and North/Northeast Brazil dry (and hot).
Be mindful that although forecast models are wetter across Brazil the next 15 days, ongoing wet bias is present in 15-day forecasts for Brazil (Fig. 8).
The SSTA-based constructed analog climate forecast from Climate Impact Company will be updated this week. The current forecast maintains a wet bias in East Brazil for December reversing much drier in January (Fig. 9-10). Note the developing Northern Argentina dryness.
Charts of the Day
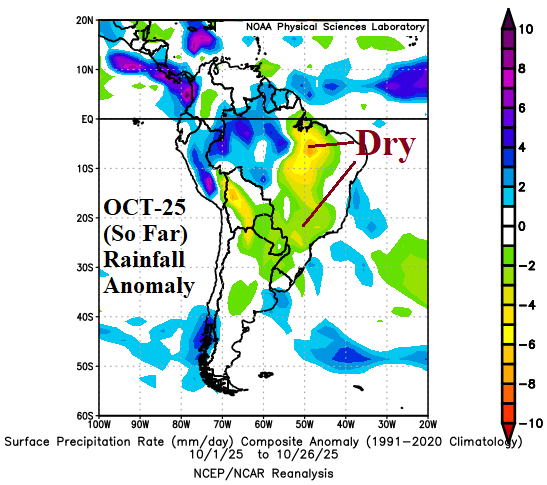

Fig. 1-2: The precipitation anomalies so far during OCT-25 across South America and the daily soil moisture anomalies analysis from NOAA/CPC.
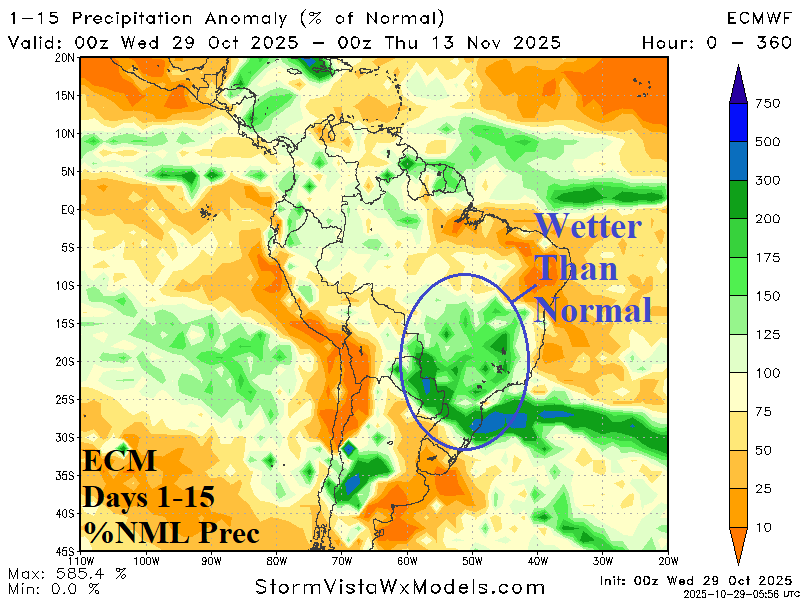
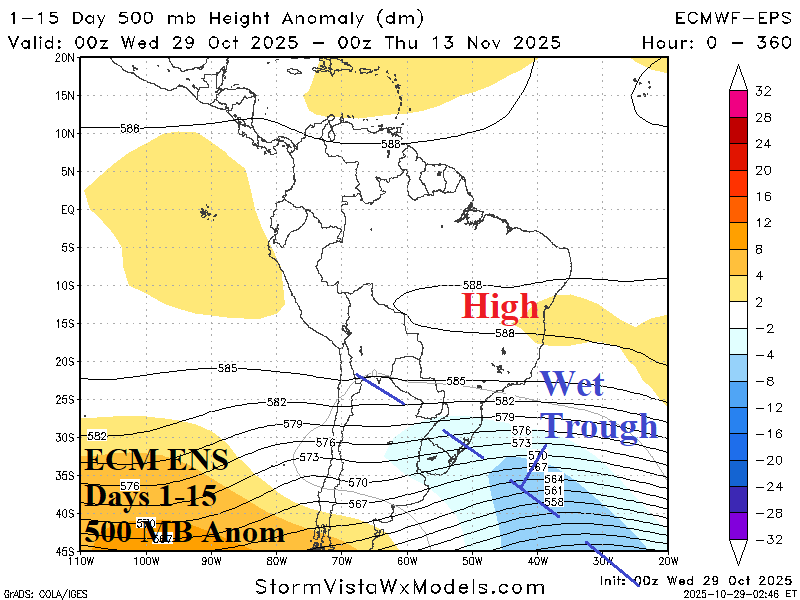
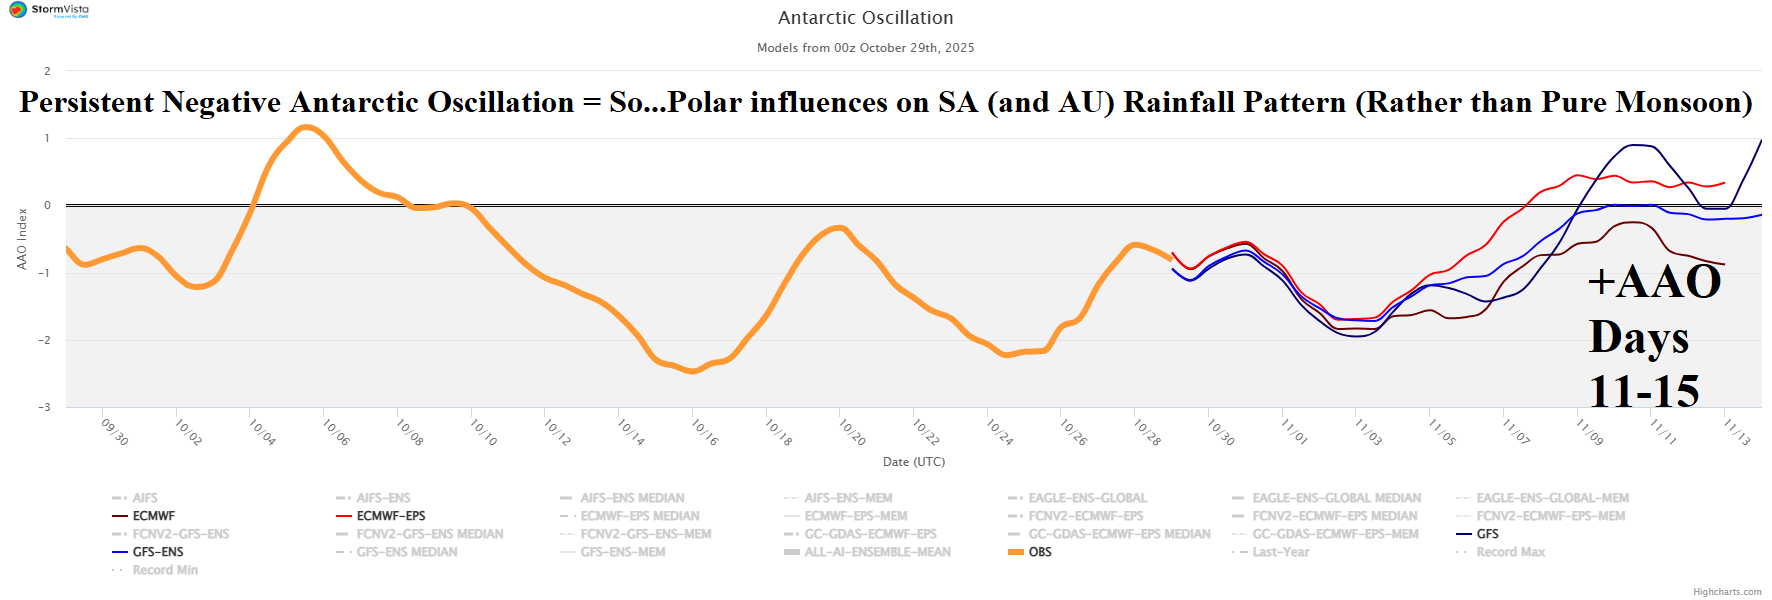
Fig. 3-5: ECM 15-day rainfall anomaly forecast across South America and the attendant (ECM ENS) upper air forecast plus identification of ongoing negative Antarctic oscillation forecast to ease after 10 days.
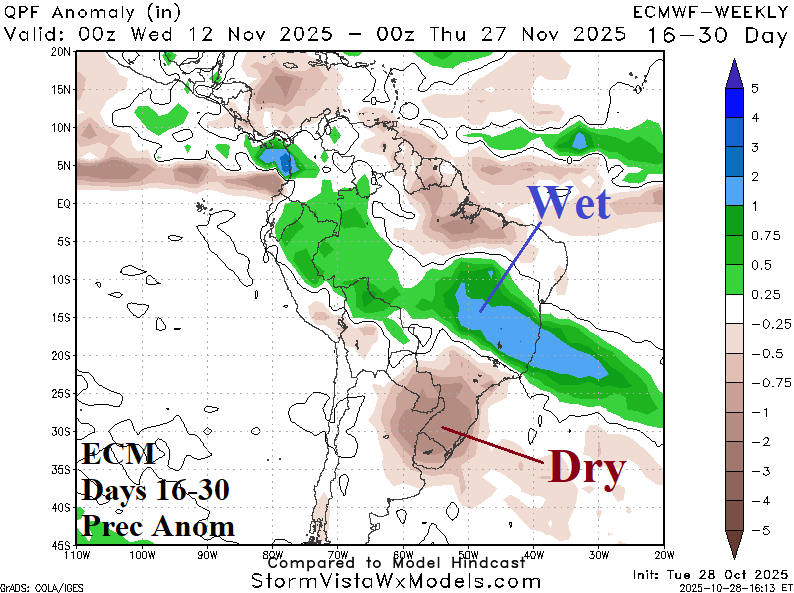

Fig. 6-7: ECM and AI Graph Cast 16-30-day rainfall anomaly forecast across South America.

Fig. 8: Ongoing wet bias of ECM ENS for 15-day rainfall forecasts across Brazil.


Fig. 9-10: Climate Impact Company DEC-25 and JAN-26 rainfall anomaly forecasts across South America.