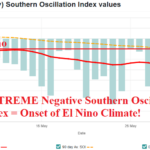
El Nino Climate Onset Arrives
06/04/2026, 12:13 pm EDT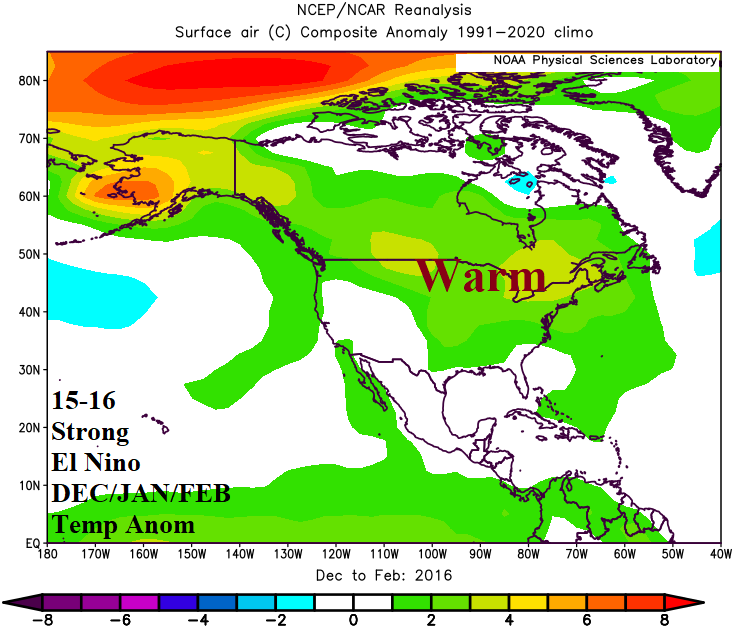

Climate Impact Company Global DEC/JAN/FEB 2026-27 Outlook
Based on Strong El Nino
Issued: Friday, June 5, 2026
Highlight: Winter warmth U.S. and Europe, Australia and Brazil heat.
Executive Summary: A glimpse at historical climate pattern across North America, Europe, South America, and Australia for DEC/JAN/FEB during strong El Nino is reviewed. Only 2 strong El Nino’s have occurred during the past 2 years. The most recent (2015-16) is likely more representative of DEC/JAN/FEB 2026-27 due to the occurrence of strong El Nino during accelerated global oceanic warming. Climate highlights include a broad warm winter pattern for North America and Europe while Brazil is mostly hot and dry with wet climate biased toward Argentina. Northern Australia is very dry and most of Australia very hot during summertime.
Climate discussion: The NOAA probabilistic ENSO strength forecast valid for DEC/JAN/FEB 2026-27 indicates about a 65% chance of relative Nino34 (R-N34) SSTA >1.5C and 35% chance of R-N34 SSTA >2.0C (Fig. 1). Likely is a significant strength El Nino during DEC/JAN/FEB 2026-27 influencing global climate. In this report, DEC/JAN/FEB outlooks for North America, Europe, South America, and Australia are indicated for 90-day periods when R-N34 SSTA was >1.5C from the past 30 years. To accommodate the acceleration of warming oceans of the past 15 years (Fig. 2), a second analog is provided referred to as the optimum climate normal (OCN) El Nino forecast. Only 2 El Nino episodes qualify, 1997-98 and 2015-16. Therefore, the comparison is a combination of both episodes and their consensus temperature and precipitation anomalies versus the singular 2015-16 event.
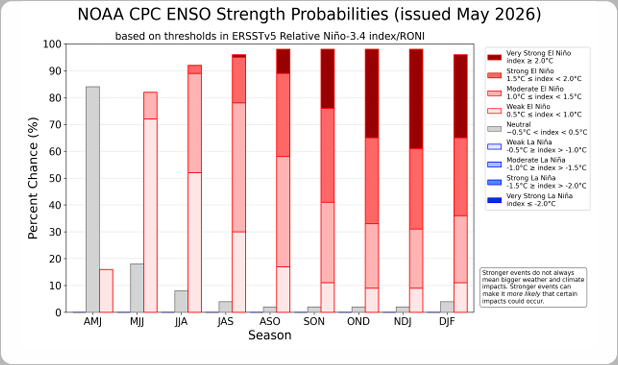
Fig. 1: The NOAA/CPC ENSO strength probability forecast valid through DEC/JAN/FEB 2026-27.
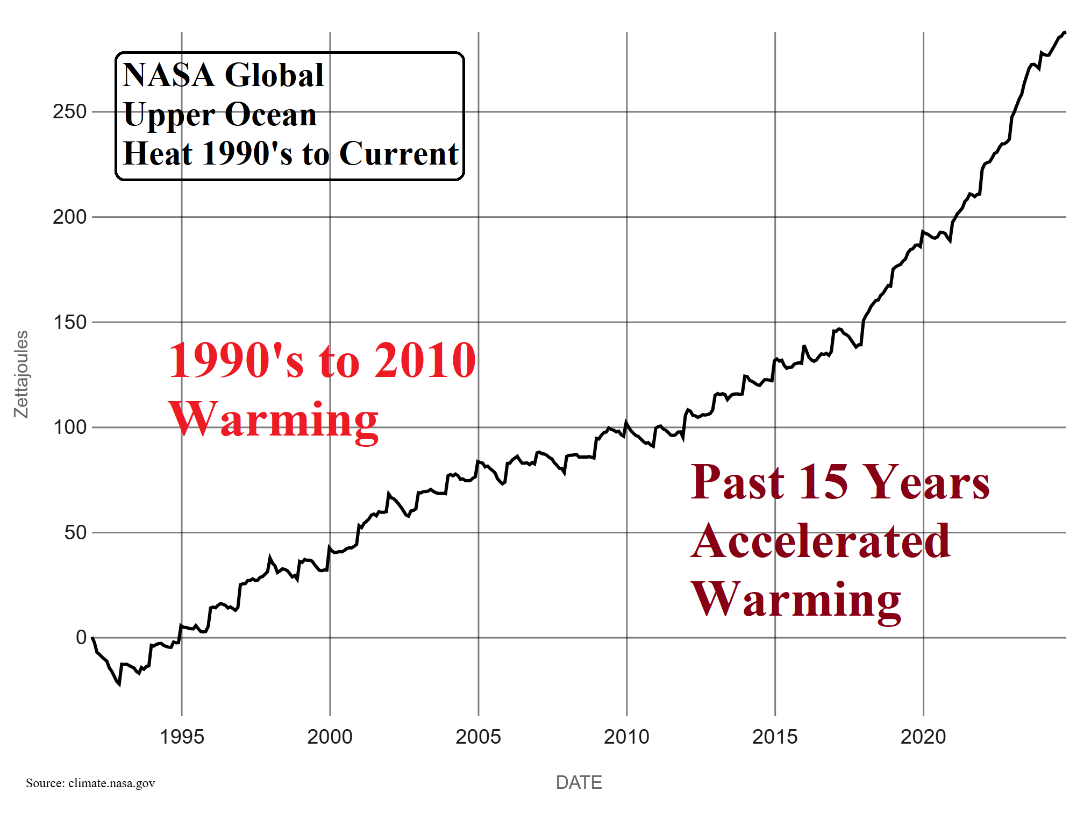
Fig. 2: NASA depiction of global upper ocean heat from the 1990’s to present clearly identifying the acceleration of warmth during the past 10-15 years.
North America: The meteorological winter climate signature across North America during El Nino is warmer than normal for most of the U.S. and Canada. The Southwest U.S. can be cooler than normal. Stormy weather affects the Coastal Northwest U.S. and Gulf/Southeast U.S. States. The modern El Nino is similar.
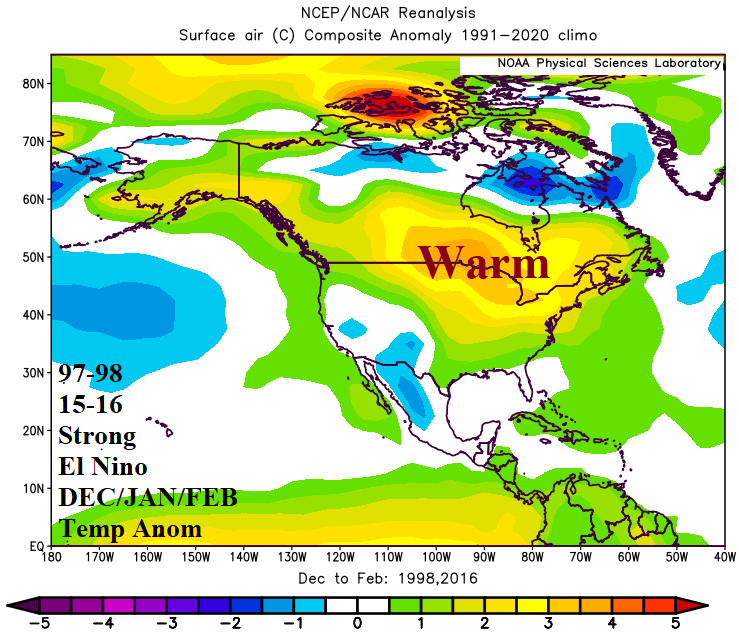
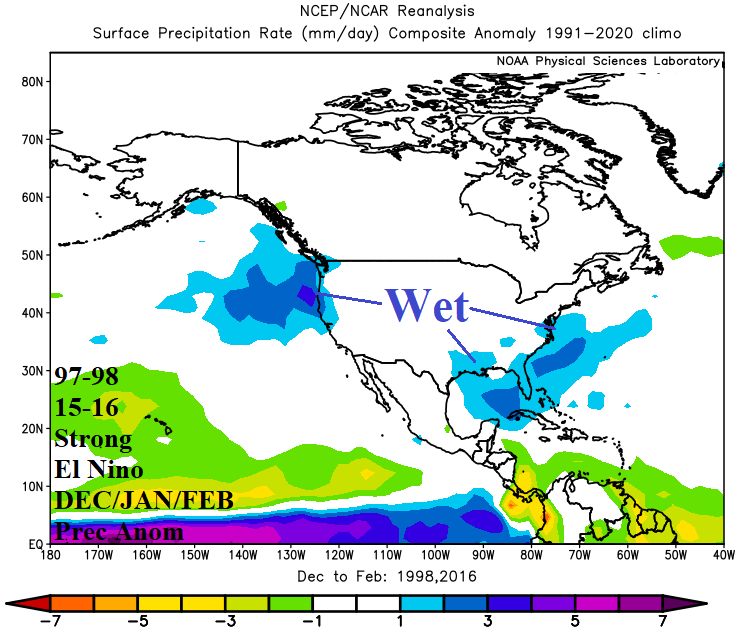
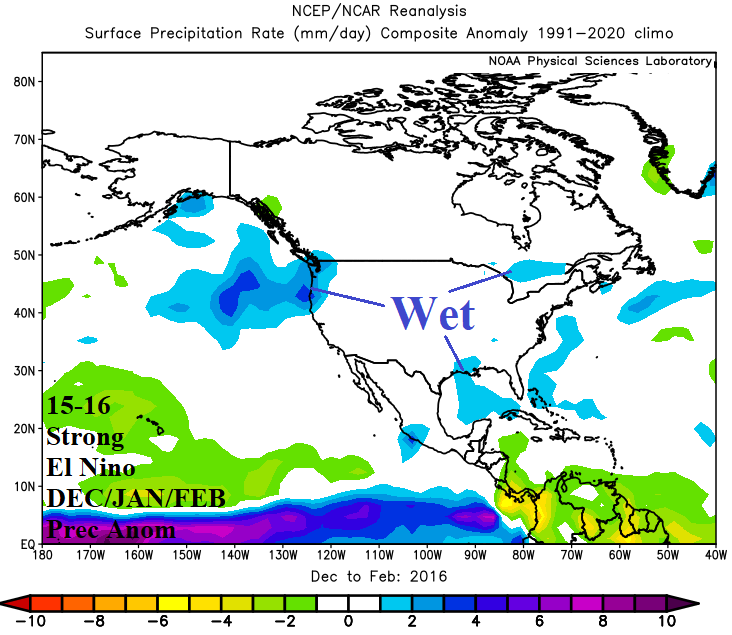
Fig. 3-6: The North America DEC/JAN/FEB 2026-27 temperature and precipitation anomalies analog forecast based on R-N34 SSTA >1.5C during DEC/JAN/FEB from the past 30 years and past 15 years.
Europe: Anomalous warmth dominates Europe during meteorological winter. Scandinavia is normally cold while Northwest Russia can be very cold. The precipitation pattern is wetter than normal on the West Coast, above normal rain and snow in Eastern Europe, and a drier than normal climate across Italy and vicinity.
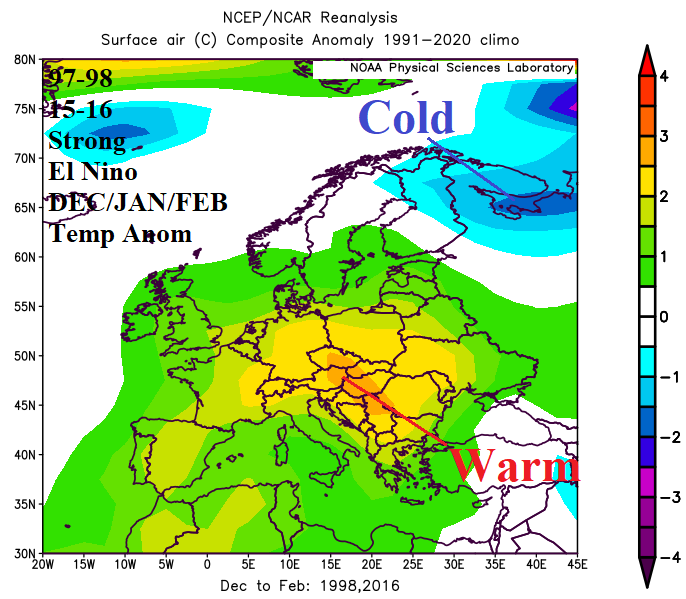
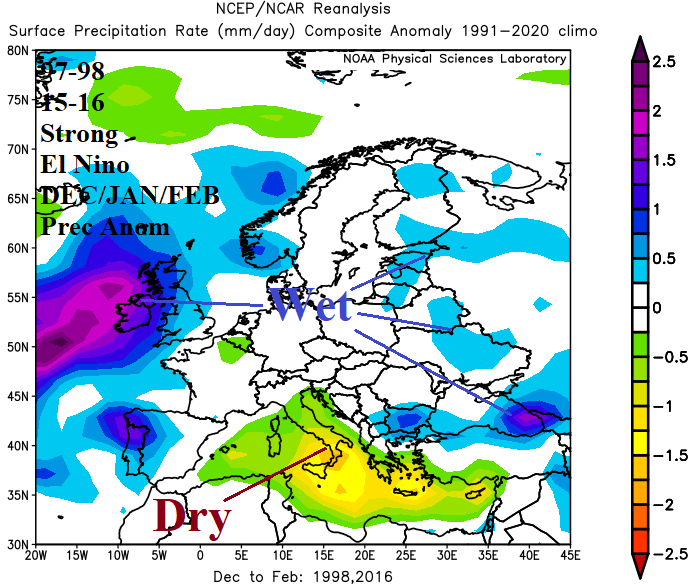
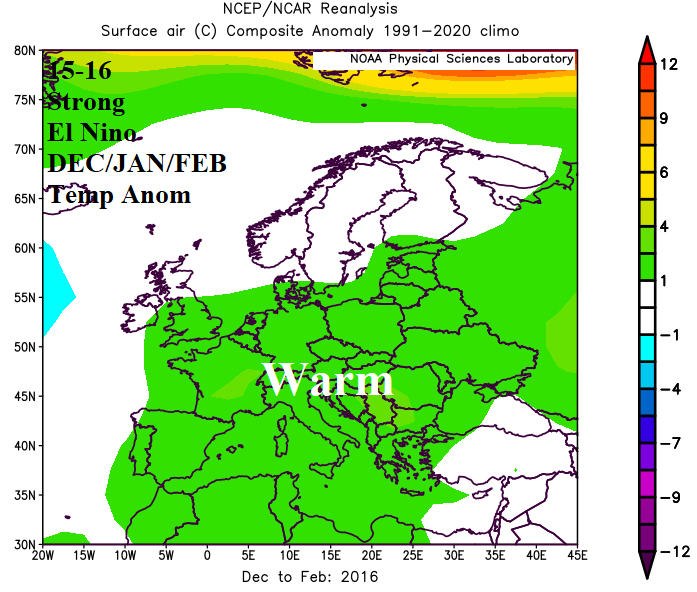
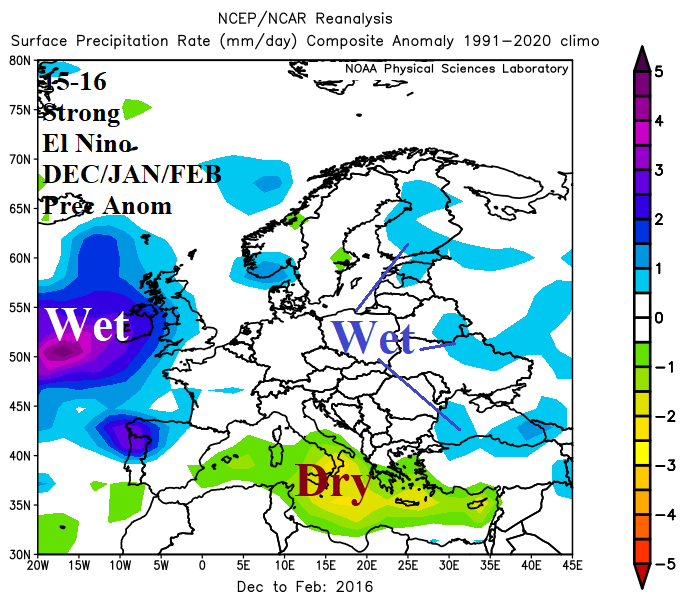
Fig. 7-10: The Europe/Western Russia DEC/JAN/FEB 2026-27 temperature and precipitation anomalies analog forecast based on R-N34 SSTA >1.5C during DEC/JAN/FEB from the past 30 years and past 15 years.
South America: Meteorological summer is hotter and drier than normal across much of Brazil. Exceptions are a potential very wet scenario over Southwest and Southeast Brazil. In Argentina, a wet climate is likely across central and north sections with suppressed heat risk in Central Argentina.
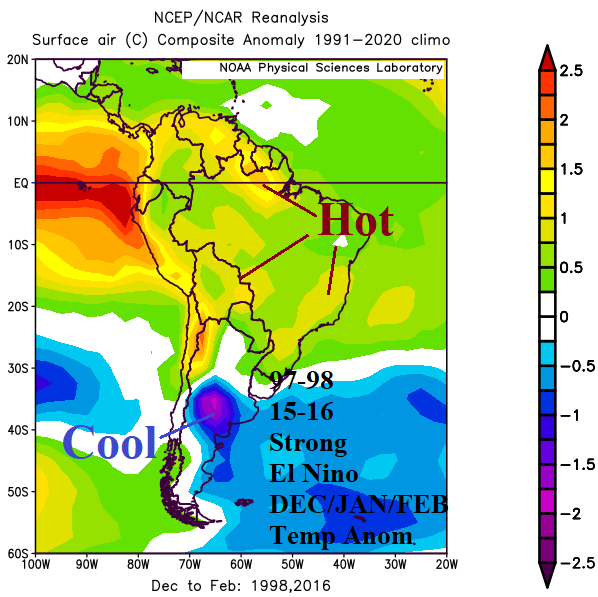
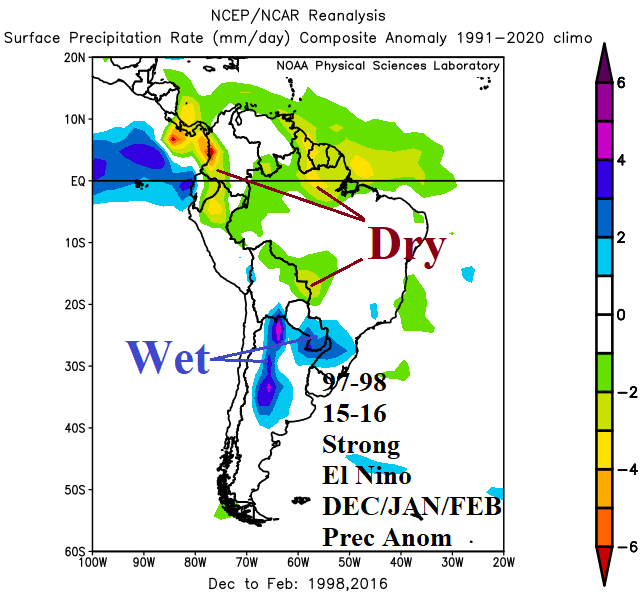
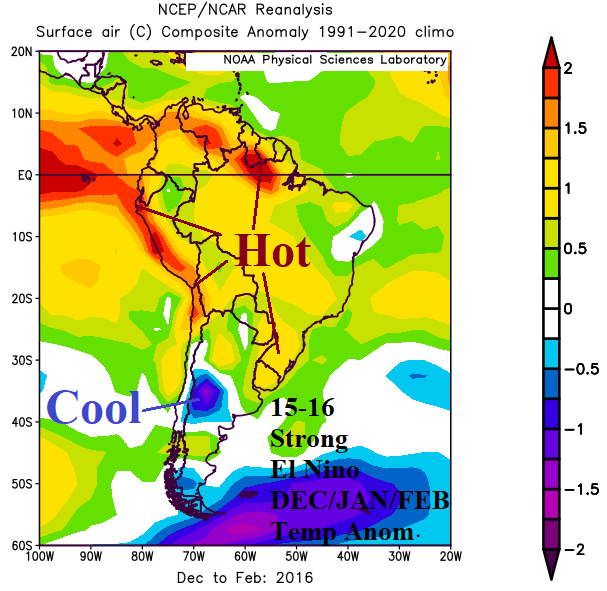
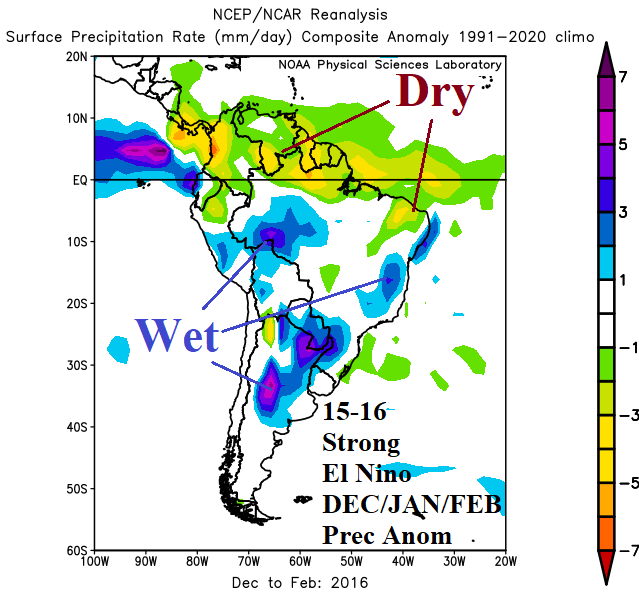
Fig. 11-14: The South America DEC/JAN/FEB 2026-27 temperature and precipitation anomalies analog forecast based on R-N34 SSTA >1.5C during DEC/JAN/FEB from the past 30 years and past 15 years.
Australia: Summertime is hotter than normal across most of Australia although the 2015-16 strong El Nino was cooler than normal across Western Australia. Dryness is most intense on the North Coast with patchy dryness on the East Coast and wet tendency in the Southwest.
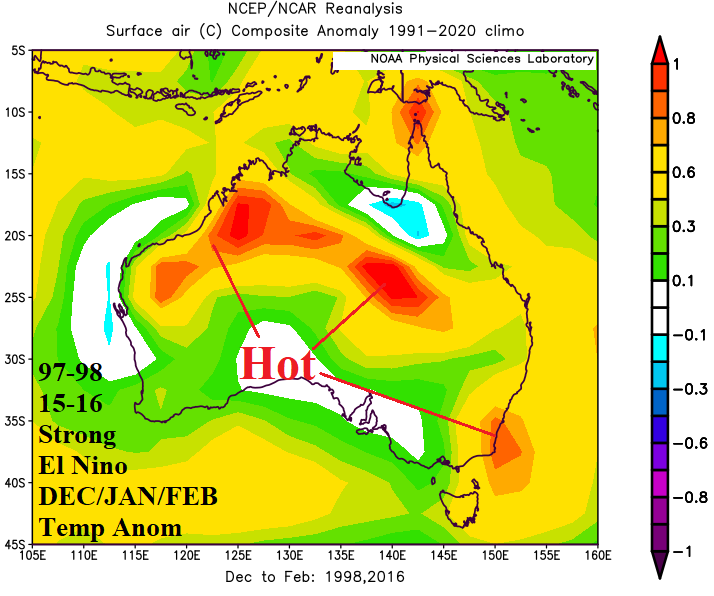
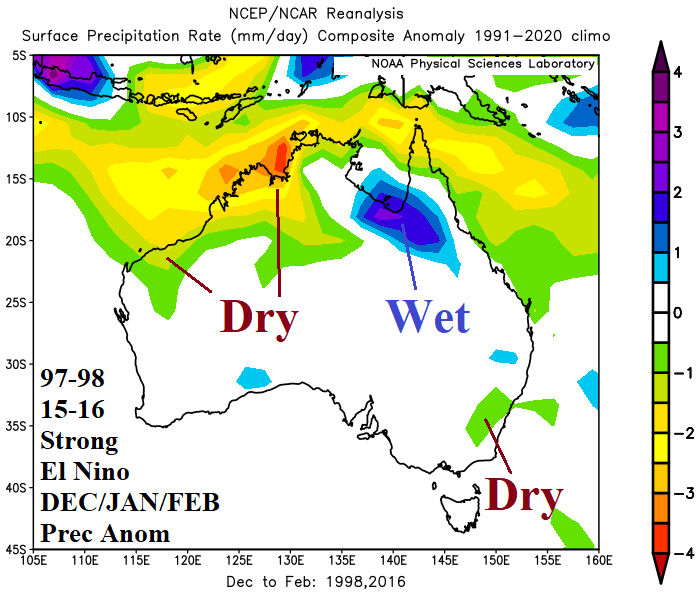
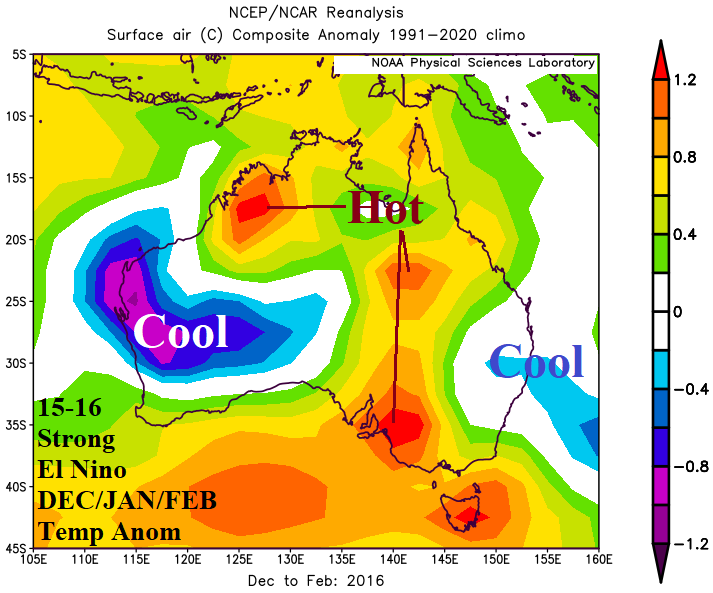
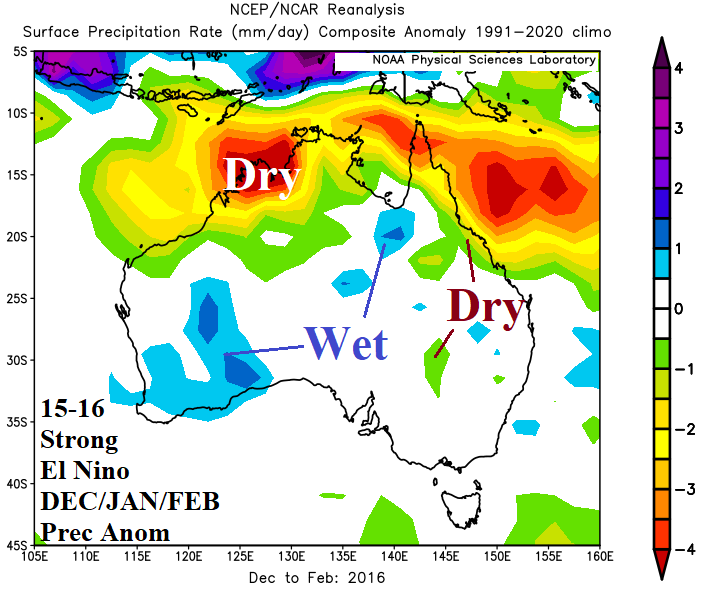
Fig. 15-18: The Australia DEC/JAN/FEB 2026-27 temperature and precipitation anomalies analog forecast based on R-N34 SSTA >1.5C during DEC/JAN/FEB from the past 30 years and past 15 years.