ECMWF “Monthlies” Aggressive with Dry/Hot Climate Central/Northern Great Plains JUL/AUG/SEP
06/05/2025, 9:18 am EDT
Operational Models (Except ECMWF) Leaning in Weak La Nina Direction Later This Year
06/16/2025, 11:43 am EDT![]()
Climate Impact Company Daily Feature
Issued: Monday, June 9, 2025
Highlight: -GLAAM and a wetter than normal northern hemisphere pattern.

Fig. 1: The global atmospheric angular momentum 15-day forecast, and 120-day history indicated persistent negative phase supporting a wet climate pattern.
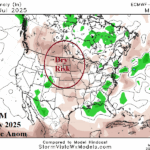
Discussion: Weekend forecasts shifted wetter in the Midwest U.S. and West/Southwest Russia. Anticipated in each region is hot/dry risk for mid-to-late summer based on probability and statistical climate forecasts. The hotter/drier expectation is put on hold. The global atmospheric angular momentum (GLAAM) 15-day forecast returns to the negative phase and strengthens (Fig. 1). -GLAAM has been common since the middle of last February. -GLAAM is present when mid-latitude jet stream flow is slower than normal increasing the risk of longwave trough presence and attendant storminess. Interestingly, the persistent -GLAAM produced widespread wet soil moisture changes around the northern hemisphere during meteorological spring (Fig. 2). The upper air pattern produced many wet weather-producing upper troughs since March 1st (Fig. 3) and several potent longwave troughs emerge in the latest 15-day forecast (Fig. 4).
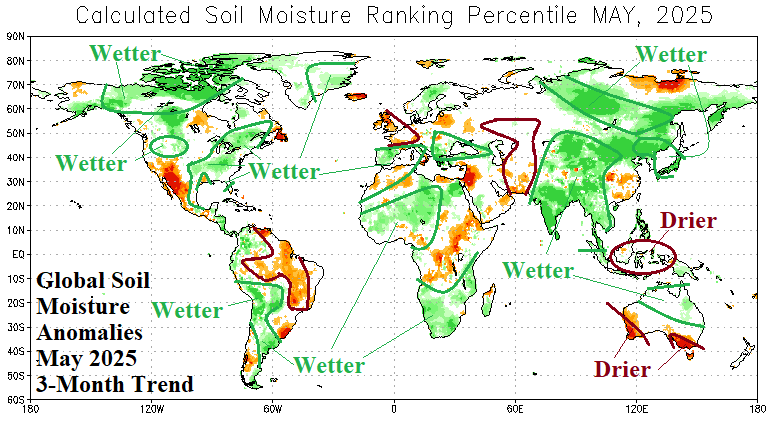
Fig. 2: The NOAA global soil moisture anomaly analysis for May 2025 and annotated 3-month change.


Fig. 3-4: The meteorological spring 500 MB anomaly pattern and ECM ENS 15-day forecast.