
U.S. Gas Population Weight HDD Forecast for 2025-26 Cold Season
10/23/2025, 8:27 am EDT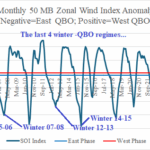
Quasi-Biennial Oscillation Phase and Sudden Stratospheric Warming Events
10/27/2025, 9:32 am EDT
![]()
Climate Impact Company Sunday AG Report
Global Weather/Climate Report
Issued: Sunday October 26, 2025
Highlight: Turning wet Southeast Brazil, how far north rains reach is questionable.


Fig. 1-2: The ECM and GFS 1-15-day precipitation forecast bias by ECM and GFS for South America.
Discussion: The performance of lead operational models forecasting rainfall across South America continues wetter than observed across northwest continent, west/southwest Brazil, and southeastward toward Uruguay (Fig. 1-2). The ECM wet bias is stronger than GFS across Brazil. The GFS indicates a moderate dry bias across Northern Brazil.
The 2-week outlook utilizes the les biased wet GFS which indicates significant rain during the next 7 days across East Paraguay and parts of far Southeast Brazil (Fig. 3). North and south of the wet stretch, very little rainfall is observed. In the 8-14-day period, GFS indicates a widening of the wet weather regime across the southern half of Brazil (Fig. 4). ECM indicates a wetter forecast compared with GFS in the 8-14-day period across Brazil.
In the 16-30-day period, ECM maintains a wet forecast bias across west and central portions of Brazil to Uruguay and Southeast Brazil (Fig. 5). CFS V2 is similar with ECM with a wet bias for central and southern continent while GFS is moderately too dry in central to northwest portions of Brazil (Fig. 6).
The 16-30-day forecast indicates an area of wet weather mostly in Paraguay and Southeast Brazil according to CFS V2 (Fig. 7) while ECM and AI Graph Cast (Fig. 8) are farther north with the wet regime.
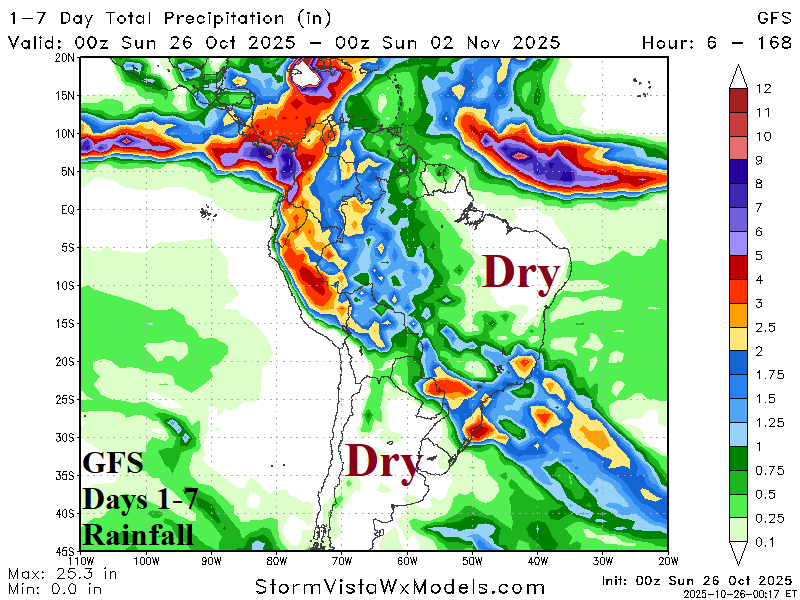

Fig. 3-4: The GFS 1-7-day and 8-14-day rainfall amount forecast across South America.
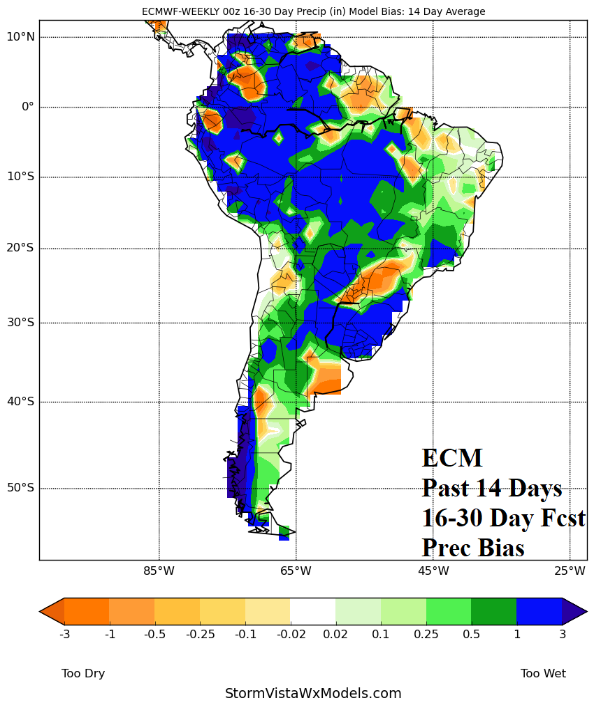
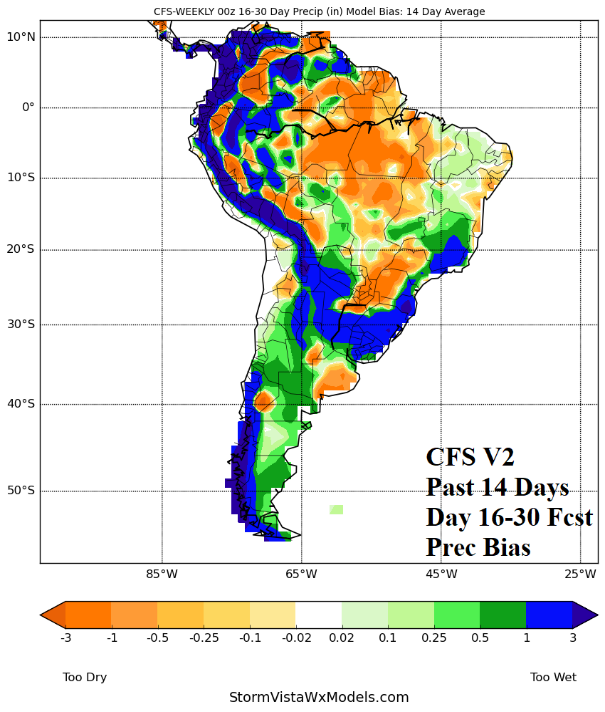
Fig. 5-6: The ECM and CFS V2 16-30-day precipitation forecast bias during the past 14 days across South America.

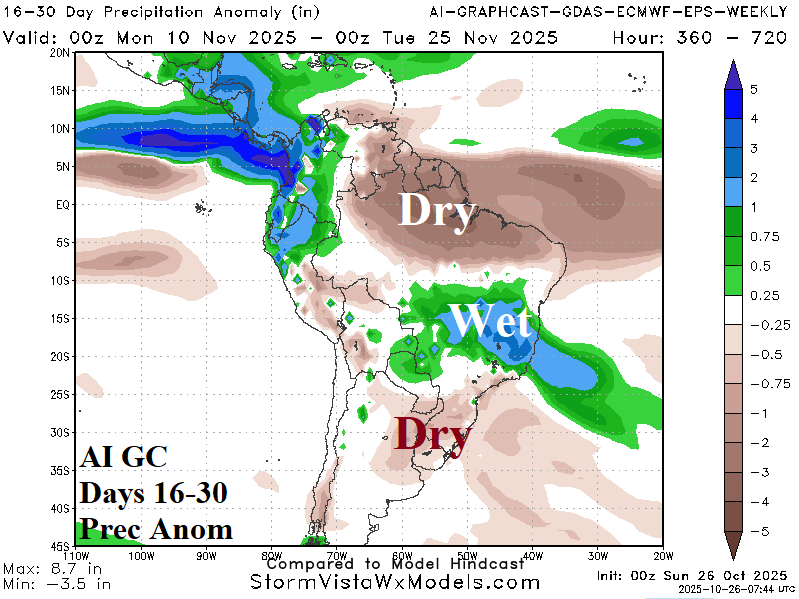
Fig. 7-8: The CFS V2 and AI Graph Cast 16-30-day rainfall anomaly forecasts across South America.