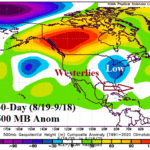
Westerly Flow Aloft Defeating Western North Atlantic Basin TC Risk
09/21/2025, 9:30 am EDT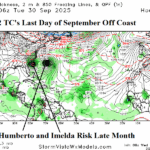
Tropics to Activate; Busy October Ahead
09/24/2025, 6:07 am EDT
Climate Impact Company Early AG Market ALERT
Issued: Tuesday September 23, 2025
Discussion: Crop damage has been reported following the wet monsoon season across India. Extreme heat was present in April into May across the Northwest followed by an extremely wet summer season (Fig. 1). The combination of extreme climate patterns triggered crop damage for northwestern India. However, a mostly wet summer season also affected wheat in Central India. Meteorological summer was not as hot as usual (Fig. 2) except for some anomalous heat northeast to central India during late meteorological summer. So far in September, the mostly wet regime has continued (Fig. 3) and the 15-day outlook offers additional heavy rainfall (Fig. 4).
Canadian duram crop samples show damage by wet weather according to a Reuters report issued yesterday. The damage is likely related to a dry start to summer ending very wet in August. The JUN/JUL/AUG 2025 precipitation anomalies are misleading indicating widespread dryness (Fig. 5) while the southern prairies were soaking wet in August (Fig. 6).
Charts of the Day
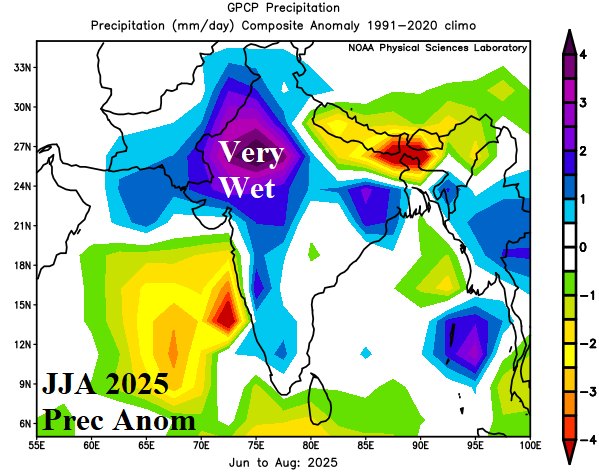
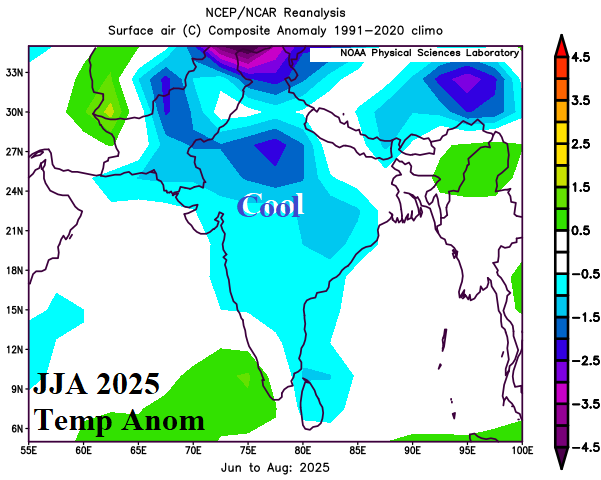
Fig. 1-2: The JUN/JUL/AUG 2025 precipitation and temperature anomaly observations across India.
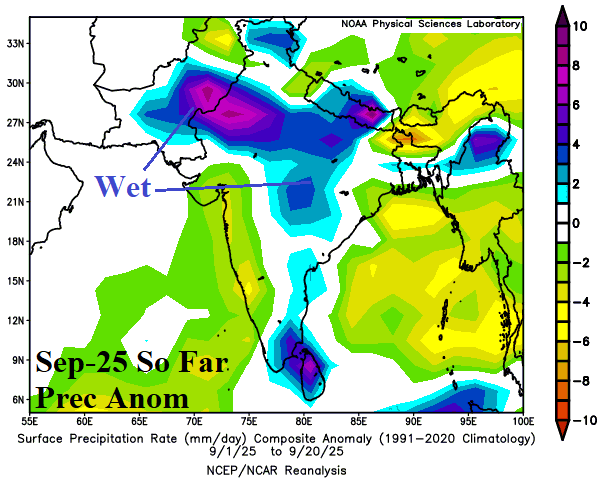
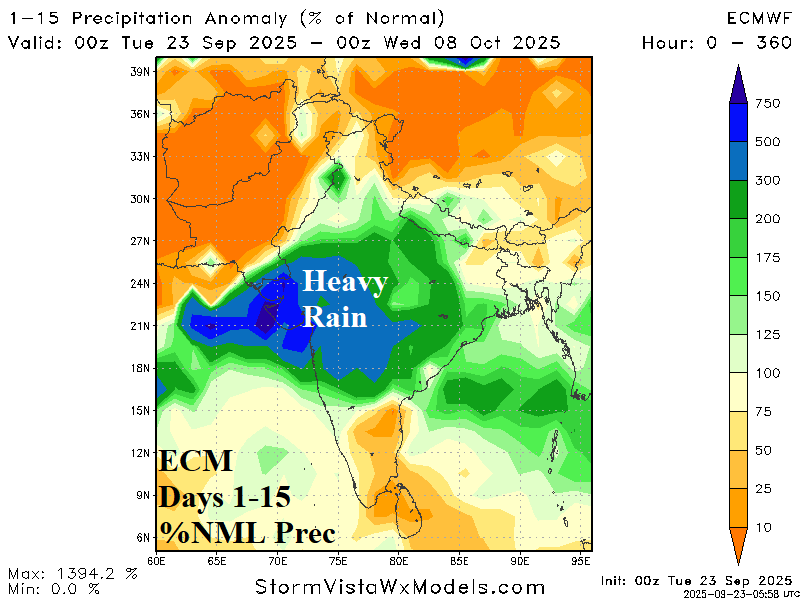
Fig. 3-4: September rainfall anomalies so far across India and the ECM 15-day percent of normal rainfall outlook.
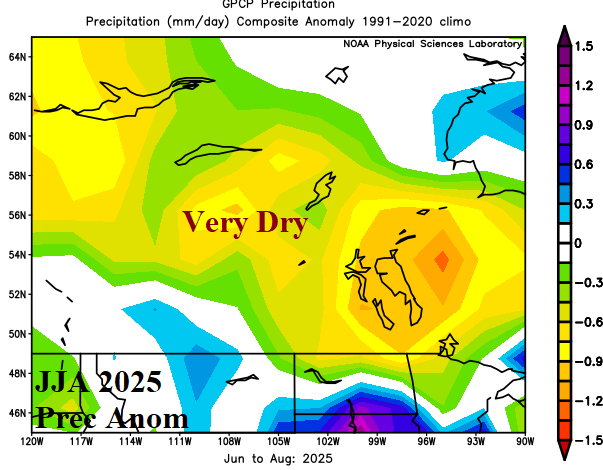
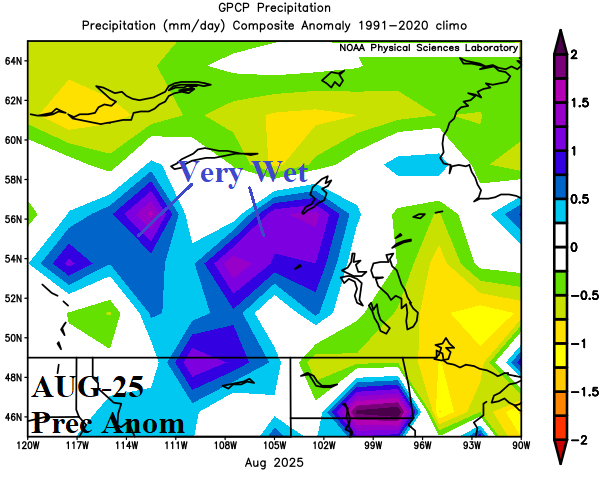
Fig. 5-6: The Canadian meteorological summer 2025 rainfall anomalies and AUG-25 rainfall anomalies.