
Soil Moisture Conditions/15-Day Outlooks Most Crop Areas
08/28/2026, 10:56 am EDT
Derecho-style Severe Storms Possible Eastern Ohio Valley to Mid-Atlantic TUE/WED
08/31/2026, 5:08 am EDT

Climate Impact Company Sunday Agriculture Report
Issued: Sunday, August 30, 2026
Highlight: Widening Brazilian rainfall ahead…Why? Wet pattern in Australia. Does it last (given El Nino dry bias)?
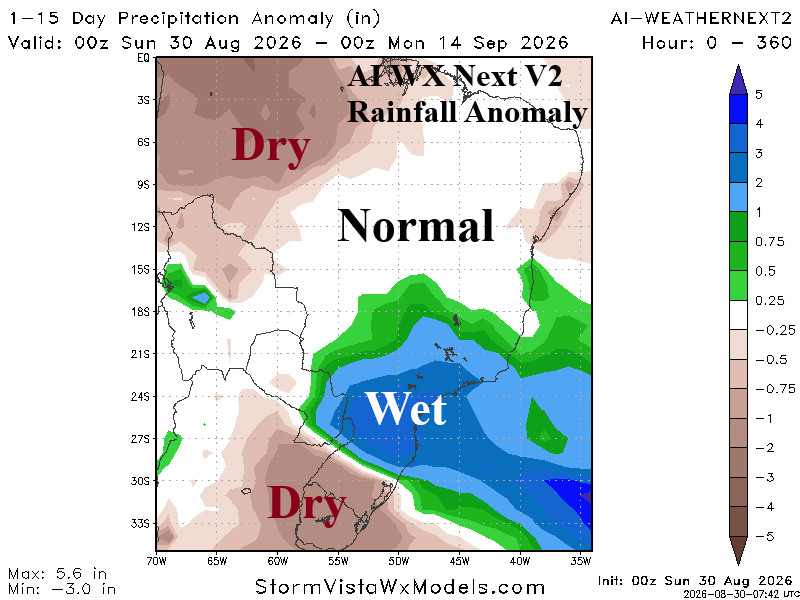
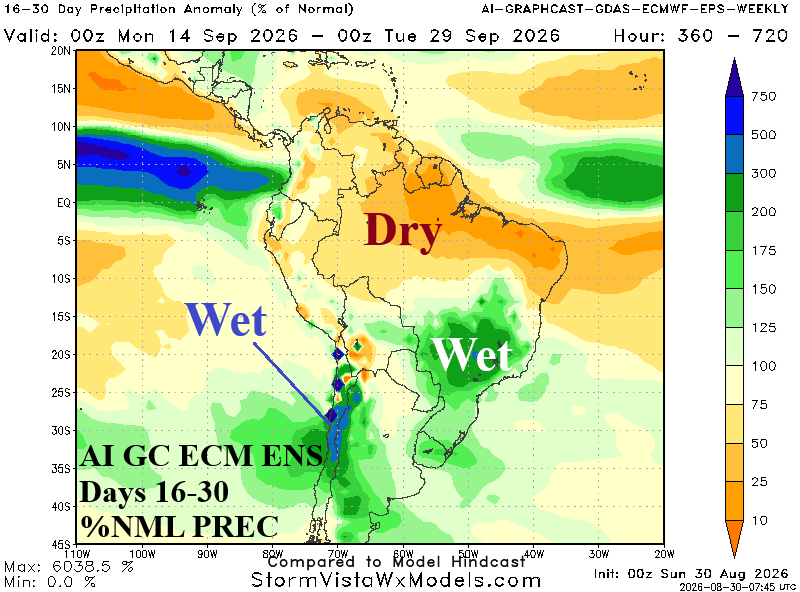
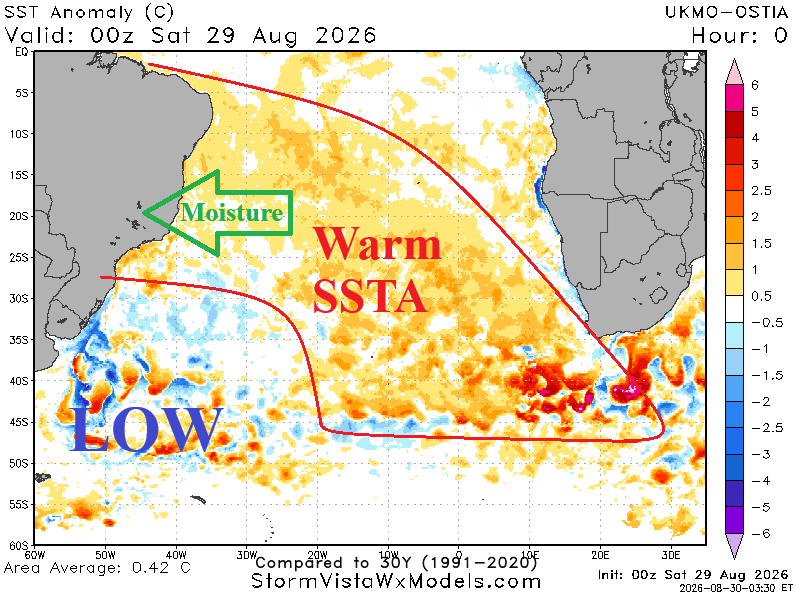
Fig. 1-3: AI Weather Next V2 15-day percent normal rainfall for Brazil, AI Graph Cast 16-30-day percent of normal rainfall outlook for South America, and daily sea surface temperature anomaly observations for the South Atlantic.
Discussion: Once again, marine heatwaves (MHW) project their influence, and sometimes interference (with ENSO), on the prevailing climate this time in South America. Utilizing AI Weather Next V2, the 15-day outlook maintains a trend which developed last week, wetter Brazil outlooks (Fig. 1). The 16-30-day outlook, also AI-generated, maintains the wet Brazil regime (Fig. 2) plus wetter weather across Chile. Northwest and North Brazil are very dry. During spring, Climate Impact Company (CIC) forecasts keep wet weather in Southeast Brazil while areas to the north are arid. IRI/LDEO probability forecasts agree with CIC. However, as indicated above, the early meteorological spring 2026 regime is wetter than expected across a larger portion of Brazil. Why? A contributing factor is semi-permanent upper-level low-pressure over the relative cool sea surface temperature anomaly (SSTA) pattern off the Argentina Coast (Fig. 3). Low-level atmosphere wind flow into Brazil has increased moisture to work with entrained into the low-pressure trough to produce wider aerial coverage of rain (in Brazil). The large MHW east of Brazil is a significant contributor to the wetter than expected Brazil regime through September.
Similarly, the 7-day percent of normal rainfall observations across Australia reveal a wet national regime (Fig. 4) in-the-face of dry El Nino expectations. The outlooks are generally dry (and hot). Wettest and least hot, in-line with persistence, is the AG GFS 15-day outlook (Fig. 5) and AI Graph Cast 16-30-day forecast (Fig. 6) each indicating patchy rain although Eastern Australia is trending drier, typical of an El Nino climate. The outlooks are quite warm-to-hot! Patchy rains are associated with increased low-level atmosphere moisture caused by MHW’s either side of the continent (Fig. 7).
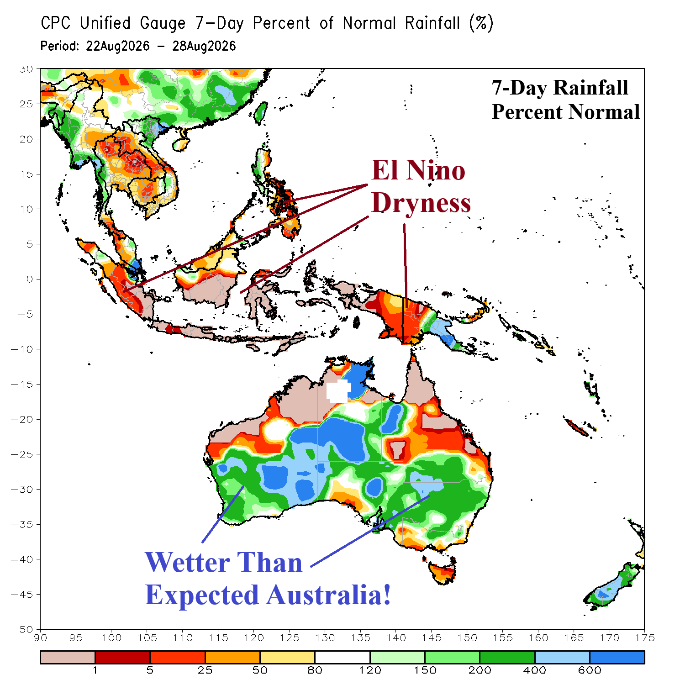
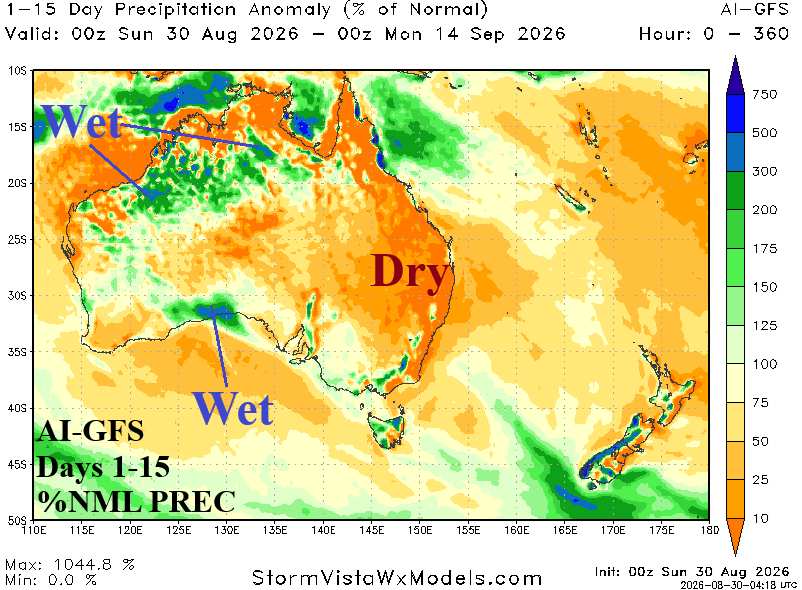
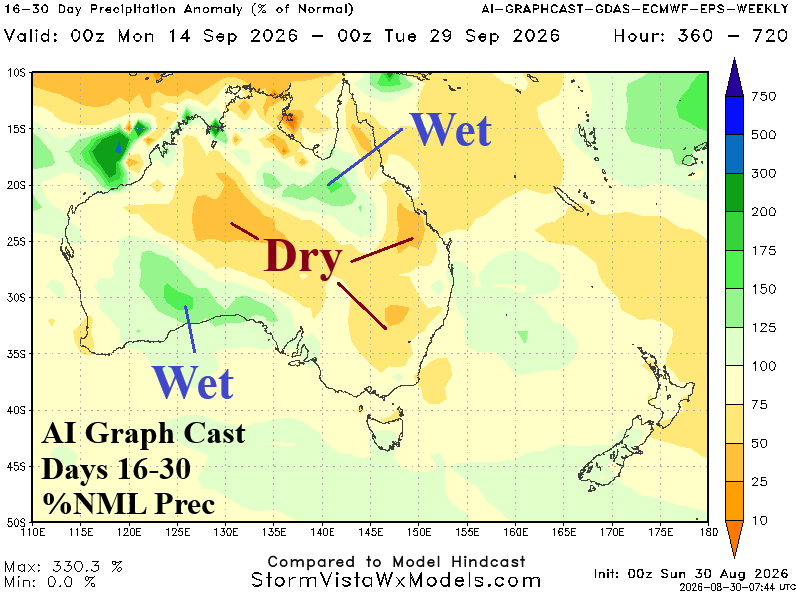
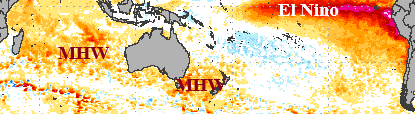
Fig. 4-7: The 7-day percent normal rainfall observations across Australia, Indonesia, and Southeast Asia plus the AI GFS 15-day percent normal rainfall forecast across Australia and AI Graph Cast 16-30-day percent normal rainfall expectation for Australia. Daily SSTA analysis reveals MHW’s near Australia.