
South America Rainfall Forecast Bias; Week 2-4 Outlook
10/07/2025, 5:18 am EDT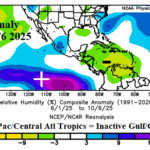
Caribbean/Gulf Subsidence/Dry Air Suppressed North Atlantic Seasonal Tropical Cyclone Activity
10/09/2025, 5:26 am EDT
Climate Impact Company Early AG Market ALERT
Issued: Wednesday October 8, 2025
Highlight: MJO supports some rain in Southern Brazil; Record heat may develop in Australia.
Discussion: The convection phase of the Madden Julian oscillation (MJO) is alive shifting eastward across the East Pacific tropics to tropical Africa and eventually western tropical Indian Ocean during the next 2 weeks (Fig. 1). Intensity is marginal although ECM indicates weak-to-moderate intensity. Usually, an MJO shift through phase_1/phase_2 increases risk of hot and dry weather in Australia and a wetter regime for South America.
The Brazil/Argentina rainfall forecast, based on equal weighting of GFS and ECM, indicates wet weather in Southeast Brazil (including coffee areas) this week (Fig. 2) and a widening wet weather zone in the 8-14-day period with heaviest rain near the Paraguay/Argentina/Brazil border (Fig. 3). Areas to the north of the wet zone are drier than normal.
In Australia, the eastward MJO shift contributes to unusually hot weather organizing this weak and potentially reaching record levels in the 8-14-day period (Fig. 4). In the 8-14-day period, the anomalous heat is accompanied by no rain in the East (Fig. 5).
Charts of the Day
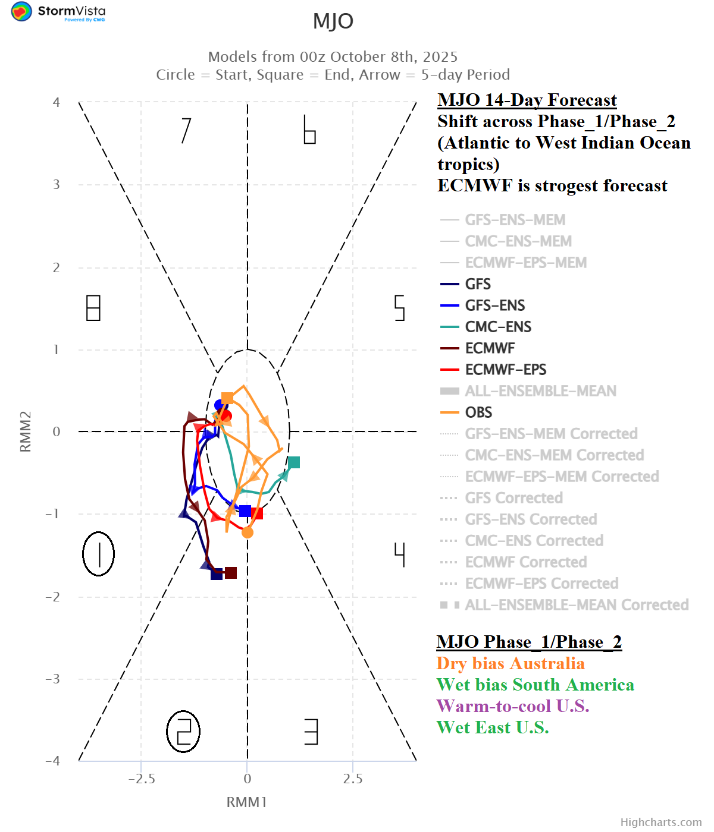
Fig. 1: The Madden Julian oscillation 14-day forecast utilizing all models.

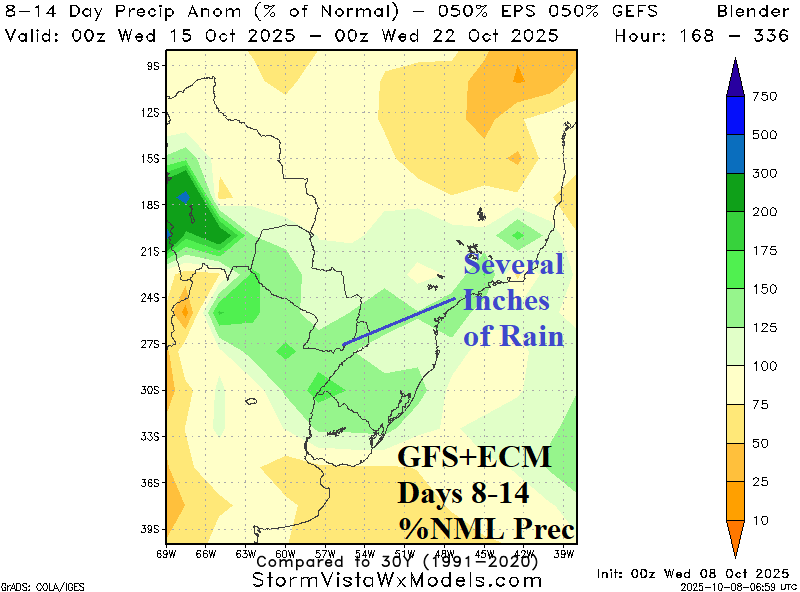
Fig. 2-3: GFS+ECM 1-7-day and 8-14-day percent of normal rainfall forecast across Brazil and Argentina.
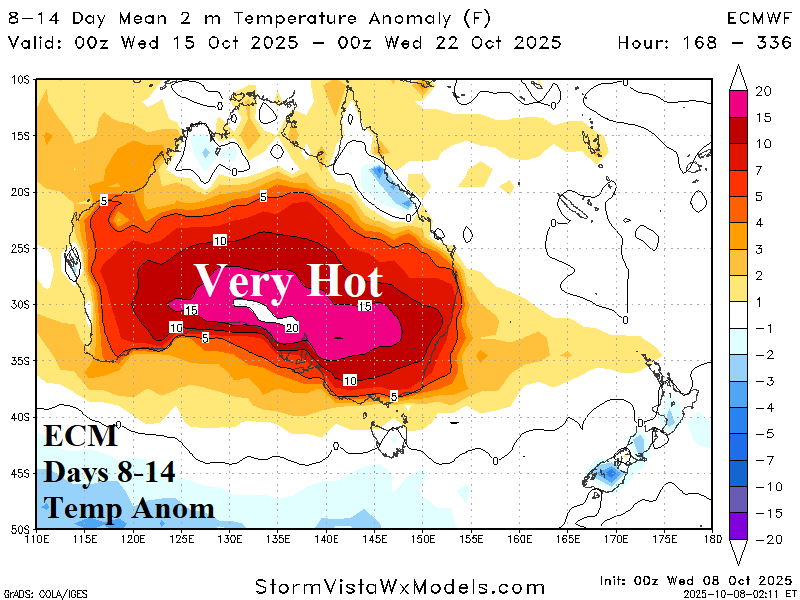
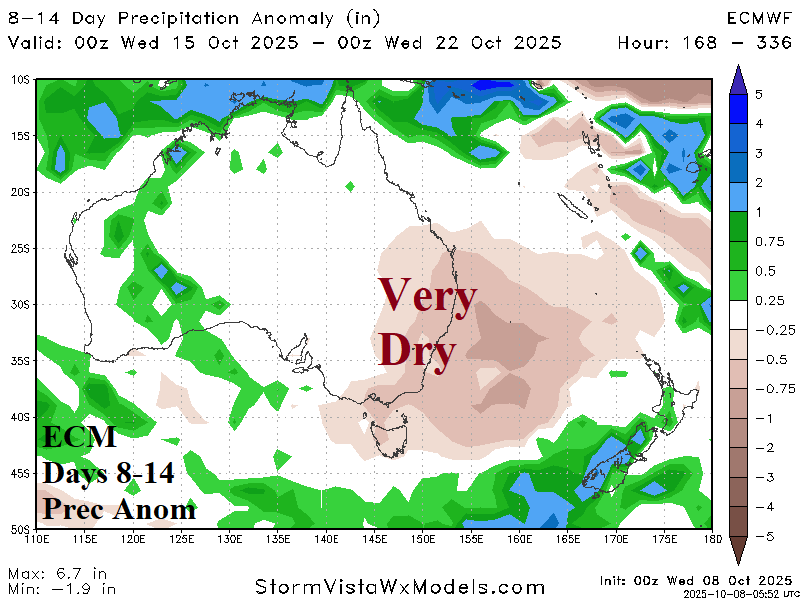
Fig. 4-5: ECM 8-14-day temperature and precipitation anomaly forecast across Australia.