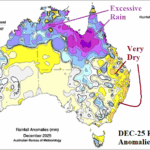
Explaining the Extremely Wet Northern Australia DEC-25 Climate
12/31/2025, 8:25 am EST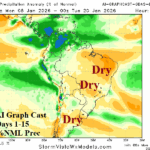
Dry-biased Graph Cast Preferred Model to Project South America Rainfall in Current Pattern
01/05/2026, 4:31 am EST
Climate Impact Company Gas/Power Report
Issued: Sunday January 4, 2026
Headline: Signs of returning cold later January.
Discussion: The mega-cluster ensemble “most likely” upper air forecast during the 11-15-day period favors an evolving return of the Northeast U.S. upper trough biased most heavily by ECM (Fig. 1). The upper air pattern invites regenerating arctic air over Western Canada in 15 days (Fig. 2). By this time, most of the U.S. warm pattern has dissipated.
The consensus of operational models U.S. gas population weigh HDD forecasts is a trend from the early January warmth back to near normal for the week ending January 22nd. The 06Z GFS was colder than the 30-year normal (Fig. 3). Interestingly, the ECM is colder for the second half of January across the Northern U.S. while CFS maintains the southern 2/3 of U.S. warmth. Therefore, the ECM/GFS HDD projections are near to below the 10-year normal in the extended range (Fig. 4). However, the machine learning models are all cold to very cold for late January into early February.
The support for a colder pattern is lead by a shift of the East Pacific oscillation (EPO) into negative phase in the 11-15-day period (Fig. 5). Other climate signals (MJO and stratosphere) are, for the moment, benign. Of course, dynamic physics-based support for a colder pattern change is not considered by AI models.
The U.S. population weight HDD for DEC-25 was 852 in between the 30-year (884) and 10-year normal (817). The JAN-26 forecast is unchanged while FEB-26 is adjusted colder and MAR-26 adjusted warmer (Fig. 6). The coldest month of the season, compared to normal, is February (Fig. 7).
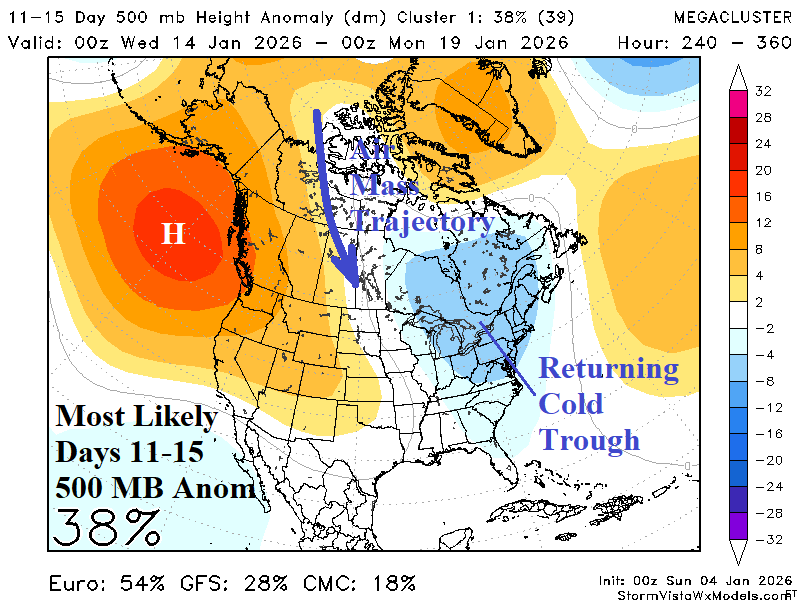

Fig. 1-2: The “most likely” upper air pattern in 11-15 days across North America according to mega-cluster ensemble and the day-15 temperature anomaly outlook.
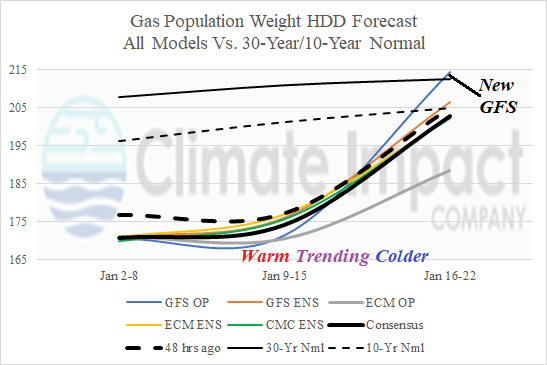
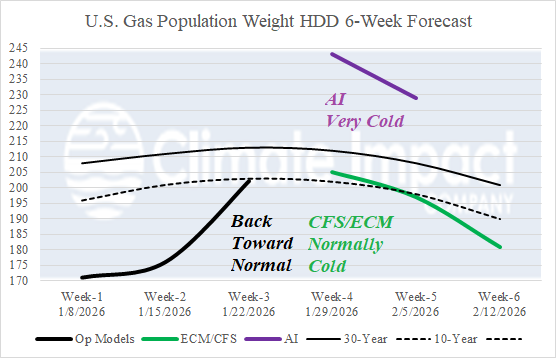
Fig. 3-4: Utilizing all models, the U.S. gas population weight HDD forecast through January 22nd adding CIC projections for week 4-6 ahead based on 3 AI models and ECM/CFS consensus.
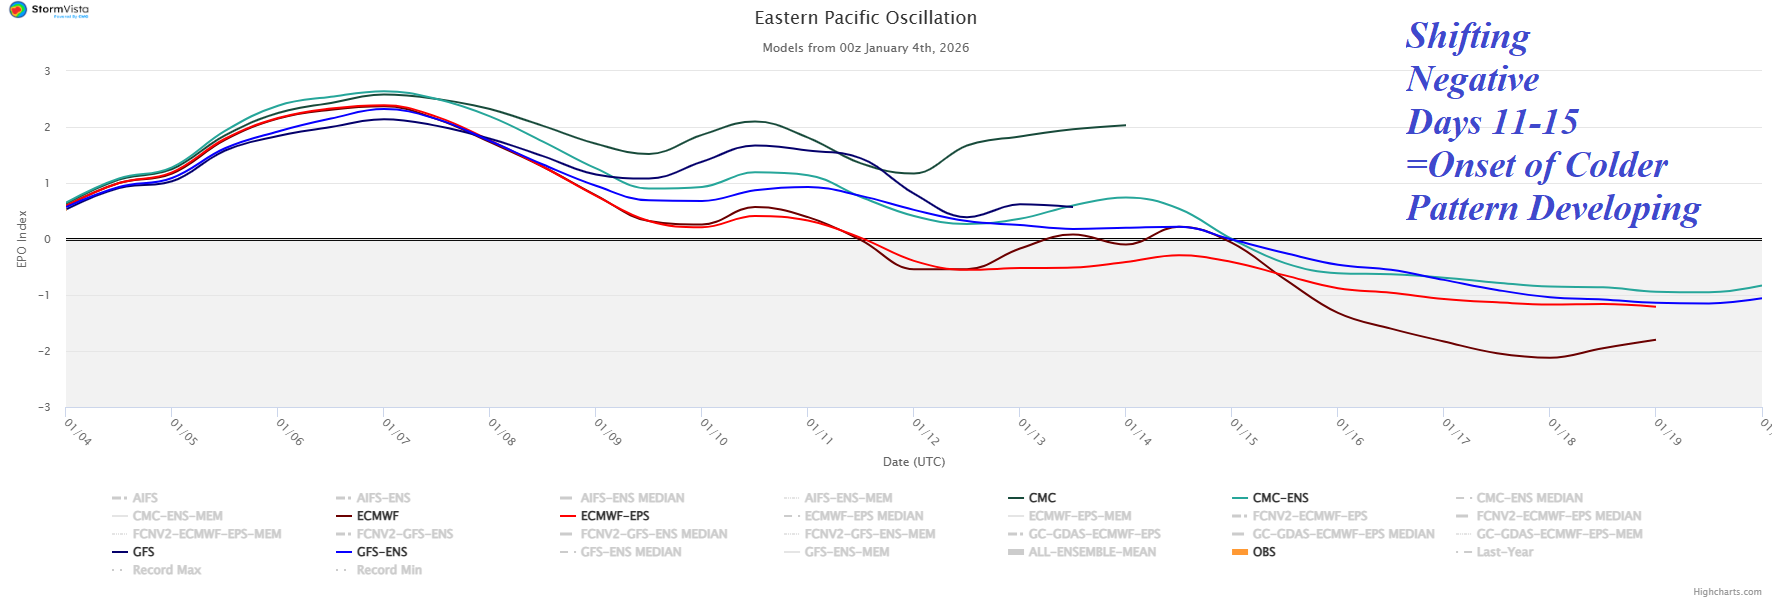
Fig. 5: The 15-day East Pacific oscillation index forecast reveals a shift to negative phase in the 11-15-day period.
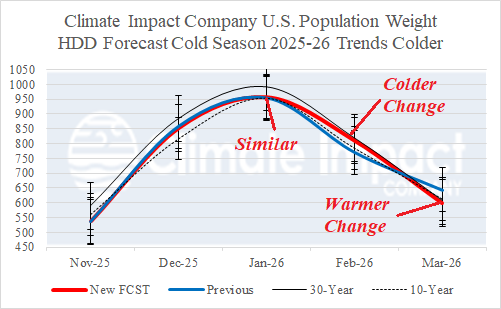
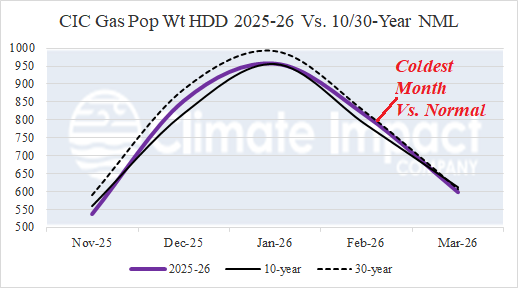
Fig. 6-7: The latest Climate Impact Company monthly U.S. population weight HDD forecast compared to previous, and the forecast compared to 30-year/10-year normal for the 2025-26 cold season. NOV and DEC values are actual.