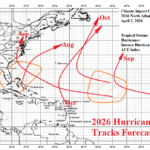
2026 North Atlantic Basin Tropical Cyclone Season Outlook
04/02/2026, 9:58 am EDT
Southeast U.S. Becoming a Warm-to-Hot Air Mass Source Region
04/07/2026, 8:11 am EDT
![]()
Climate Impact Company U.S. Easter Sunday Report
Issued: Sunday, April 5, 2026
Highlight: Emerging Madden Julian oscillation to dominate middle third of April across U.S.
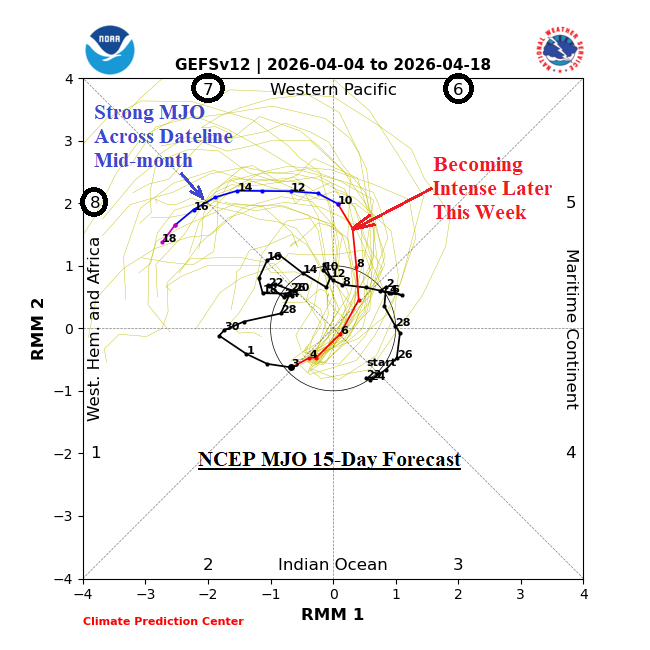
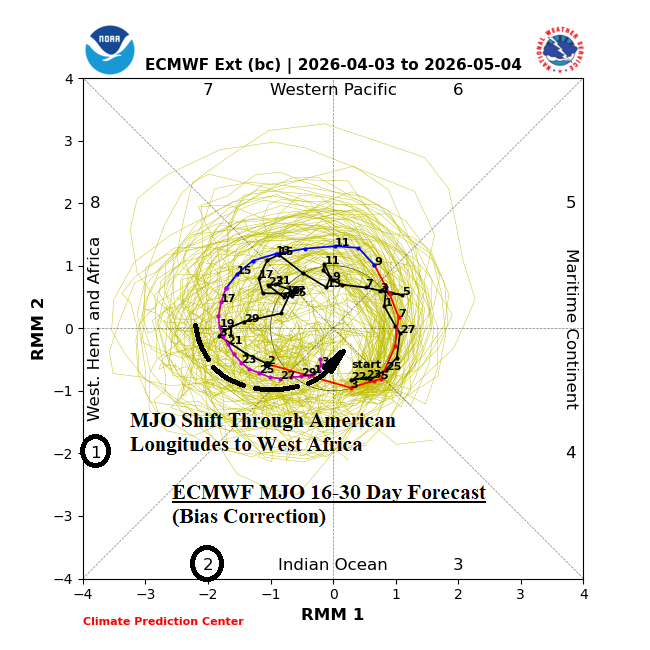
Fig. 1-2: NCEP 15-day MJO forecast and ECMWF 30-day MJO forecast. Forecast plots outside inner circle indicate moderate-to-strong MJO influence.
Discussion: Tropical forcing on the prevailing climate across North America increases during April. The Madden Julian oscillation (MJO) increases strength dramatically as the middle third of April arrives (Fig. 1). The MJO shifts toward and across the Dateline during this time. In the extended range, ECMWF maintains the MJO intensity and indicates a progressive character shifting eastward through the tropical longitudes of the Americas to West Africa by early May (Fig. 2). The influence on El Nino southern oscillation (ENSO) is already apparent as southern oscillation index (SOI) has shifted to negative phase (Fig. 3). -SOI is an indicator of an El Nino-like climate. +SOI was present for most of the boreal winter season. The MJO/SOI regime should take advantage of the rapid emergence of upper ocean heat in the East Pacific equatorial region (Fig. 4) and continue to push ENSO away from the just ending La Nina climate and toward an El Nino climate expected to emerge mid-year. The strengthening and progressive MJO brings high impact weather to the U.S. including a warm surge in the 6-10-day period followed by a much cooler outbreak in the 11-15-day forecast as indicated by ECMWF (Fig. 5-6). During the temperature transition, MJO-enhanced significant precipitation including severe weather is forecast across Texas to the Upper Midwest (Fig. 7). The cooler change is brief, and another warm surge follows in the 16-20-day period (Fig. 8) which includes additional Midwest U.S. rains (Fig. 9). Finally, as MJO shifts past the Americas toward West Africa, another cool outbreak is likely to begin May (Fig. 10) with wet weather focus shifting to the Mid-Atlantic States (Fig. 11). The U.S. gas population weight HDD forecast identifies the mid-month warm surge followed by a cooler shift April 17-23 (Fig. 12).
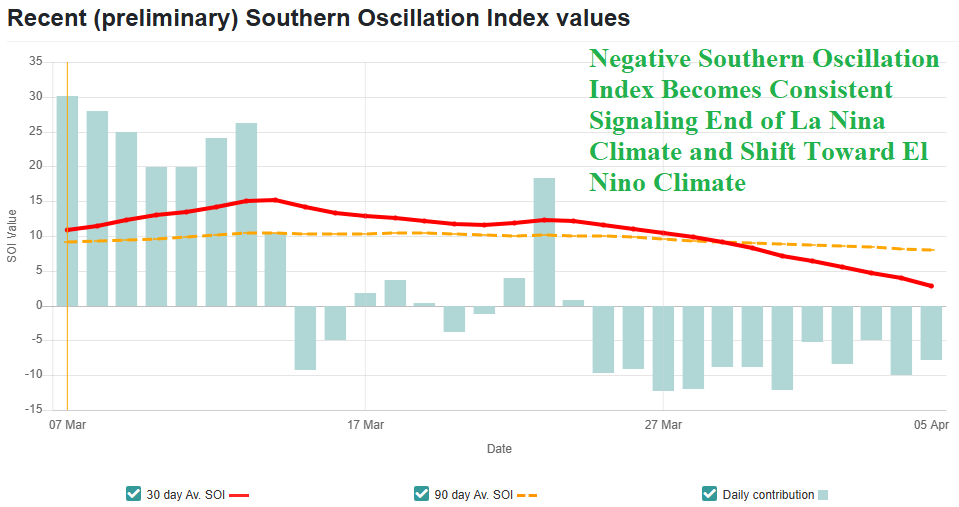
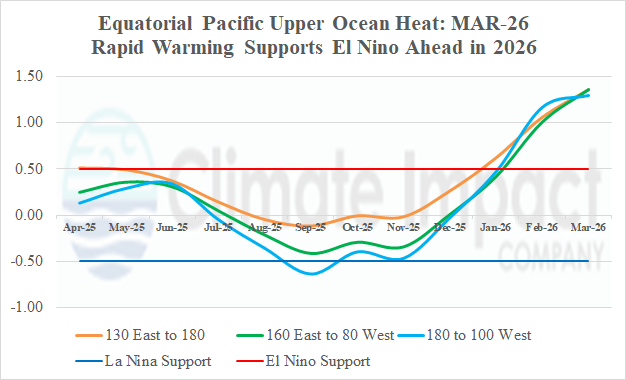
Fig. 3-4: Negative southern oscillation index has finally emerged during the past 10 days and the impressive surge in East Pacific upper ocean heat.
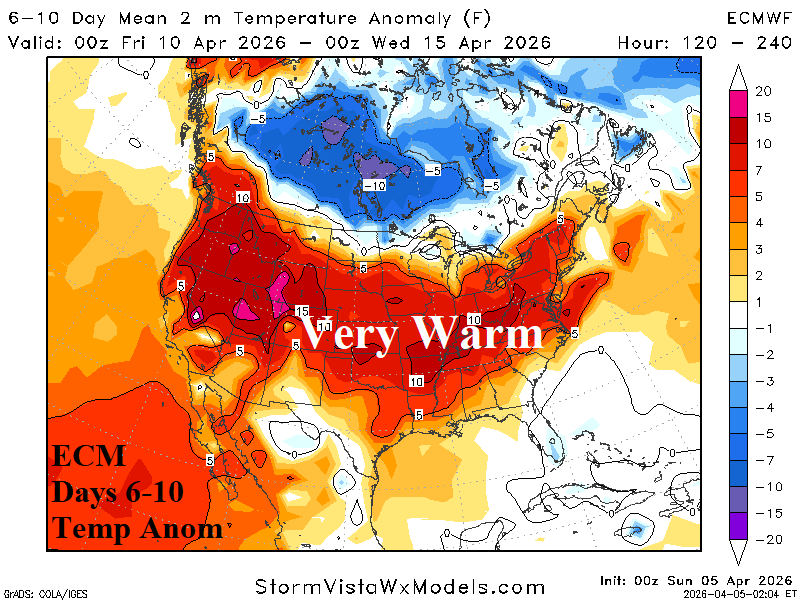
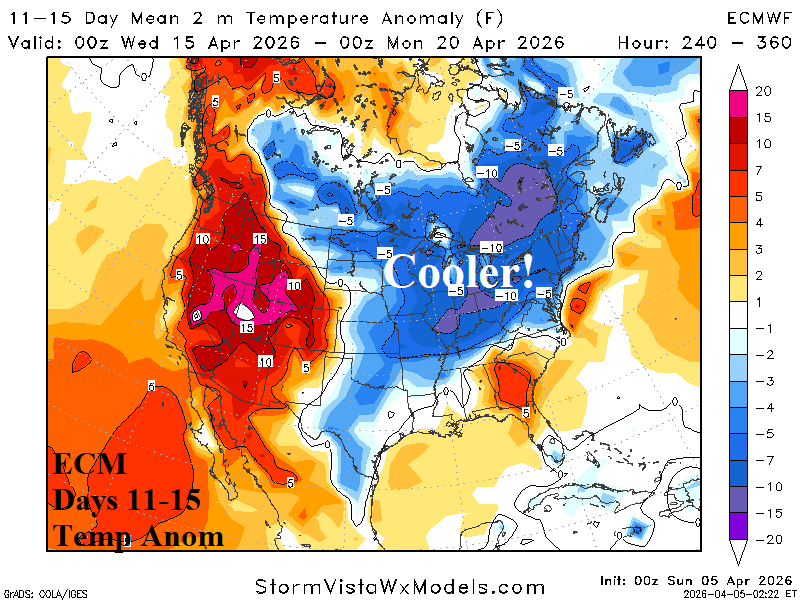
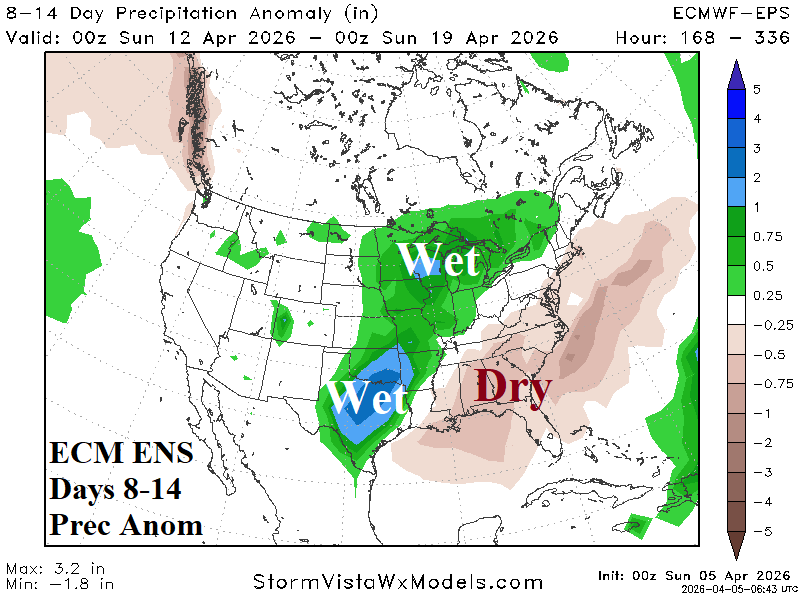
Fig. 5-7: ECMWF U.S. medium range temperature anomaly forecast and ECM ENS 8-14-day U.S. precipitation anomaly forecast.
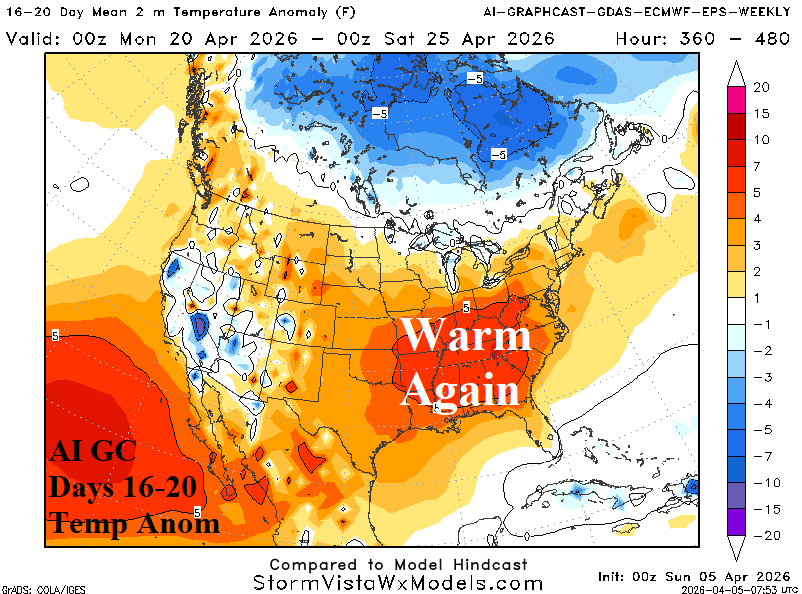
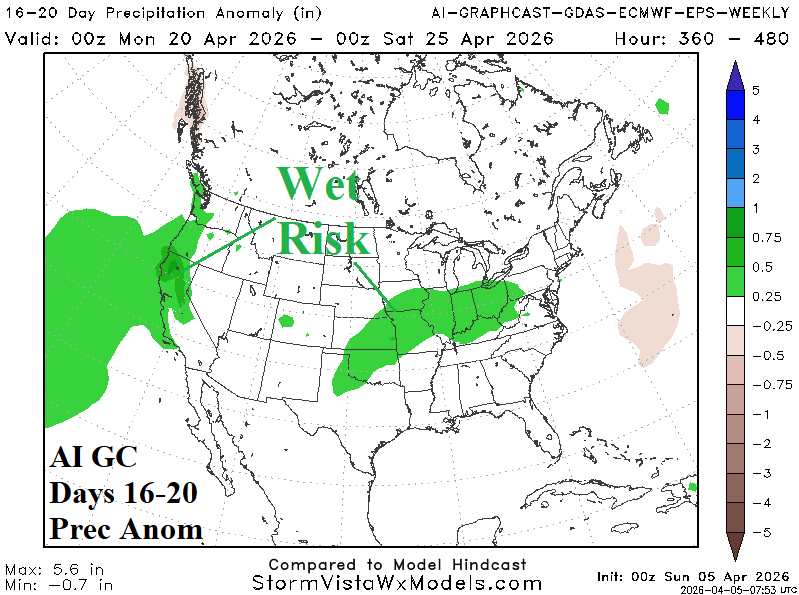
Fig. 8-9: AI Graph Cast 16-20-day temperature and precipitation anomaly forecast.

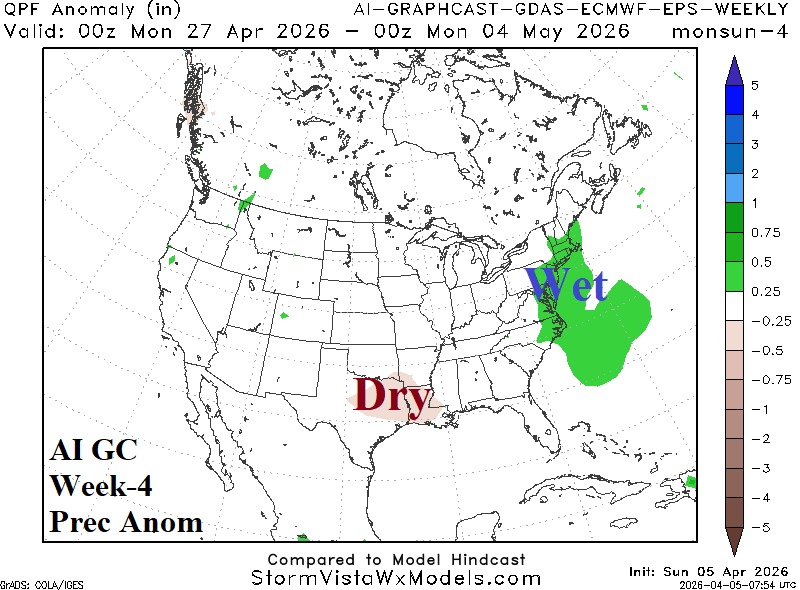
Fig. 10-11: AI week-4 forecasts indicate cooler weather returning to the Northern U.S. with wet risk shifting to the Mid-Atlantic region.
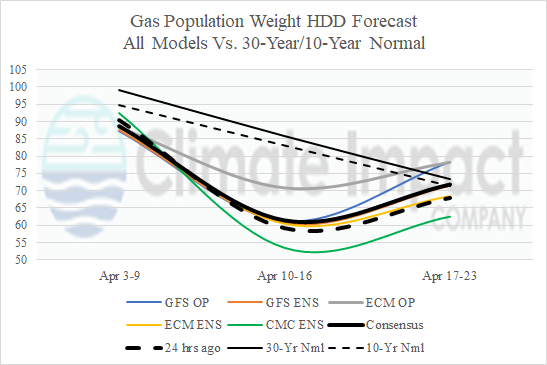
Fig. 12: U.S. gas population weight HDD forecast utilizing all models, their consensus, and comparison with 24 hours ago and 30-year/10-year climatology.