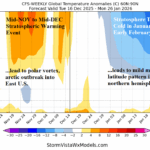
When Does The Stratosphere Warm Again?
12/16/2025, 8:56 am EST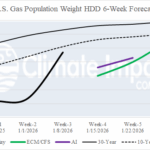
HDD Forecasts Still Favoring Below Average Heating Demand Through U.S. Mid-winter
12/19/2025, 5:46 am EST
![]()
Climate Impact Company Daily Feature
Issued: Thursday, December 18, 2025
NOAA long-lead: South/Southeast drought expansion, La Nina biased cold risk Northwest U.S. and stormy Northwest/Ohio Valley through Q1/2026.
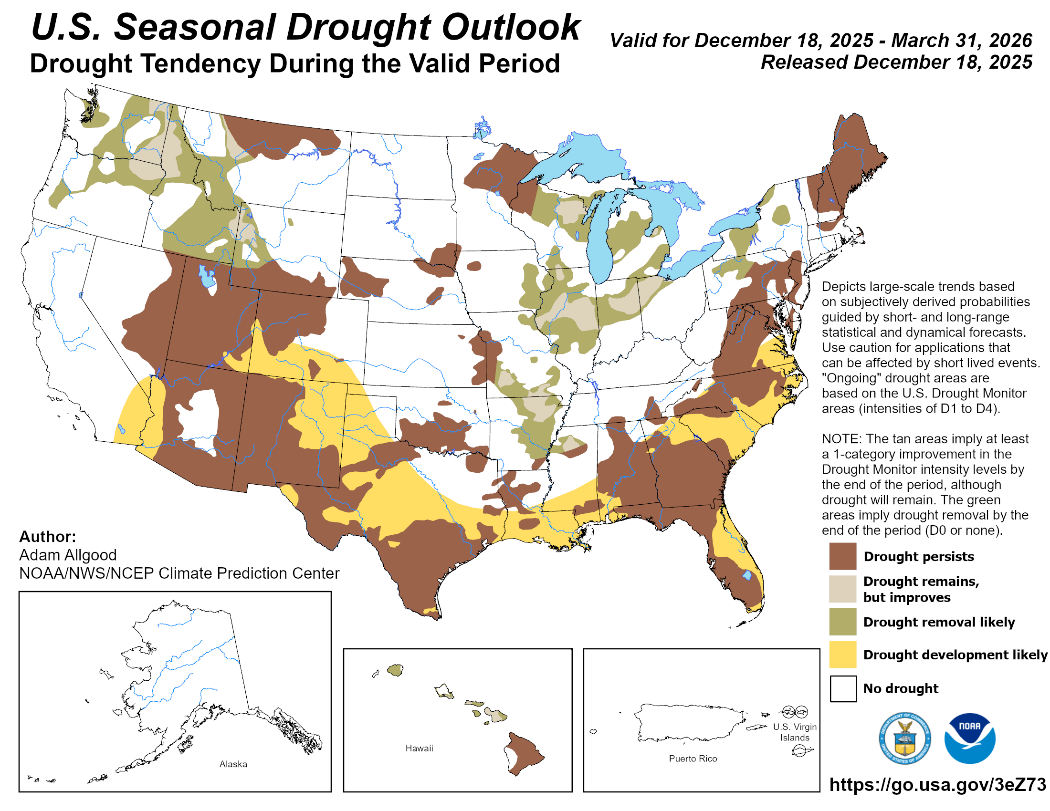
Fig. 1: The NOAA/CPC U.S. Seasonal Drought Outlook.
Discussion: The NOAA/CPC Seasonal Drought Outlook is updated. The forecast indicates drought expansion for much of the South U.S. to the Mid-Atlantic region (Fig. 1). Drought erosion or dissipation is projected for the Interior Northwest and Midwest/Mid-South U.S.
The month ahead forecast valid for January indicates the likelihood of warmer than normal climate across the Southern States with cold risk across the northern Great Plains (Fig. 2). Elsewhere, equal chance of normal, above or below normal, is indicated (low confidence). The precipitation outlook indicates high likelihood of above normal precipitation in Idaho/Montana and along the Ohio River (Fig. 3). Arizona to Texas and Florida to Georgia are drier than normal.
The seasonal outlook valid for Q1/2026 maintains cold risk near the U.S./Canada border and likelihood of warm climate across the Southern States (Fig. 4). The classic La Nina Northwest and Ohio Valley wetter than normal climate regime is indicated for JAN-MAR 2026 (Fig. 5).
During meteorological spring, the warm risk advances northward to include California and the South U.S. plus the Eastern States (Fig. 6). The spring precipitation outlook is made with below normal confidence due to the “springtime climate prediction barrier” and a transition in the ENSO cycle. Only the Great Lakes region (wet) and Southwest (dry) have precipitation prediction probabilities (Fig. 7).
Finally, the meteorological summer 2026 season is likely hotter than normal across most of the U.S. except the Midwest States (Fig. 8). The Southeast and East Coast are likely wet zones while the Northwest is drier than normal (Fig. 9).
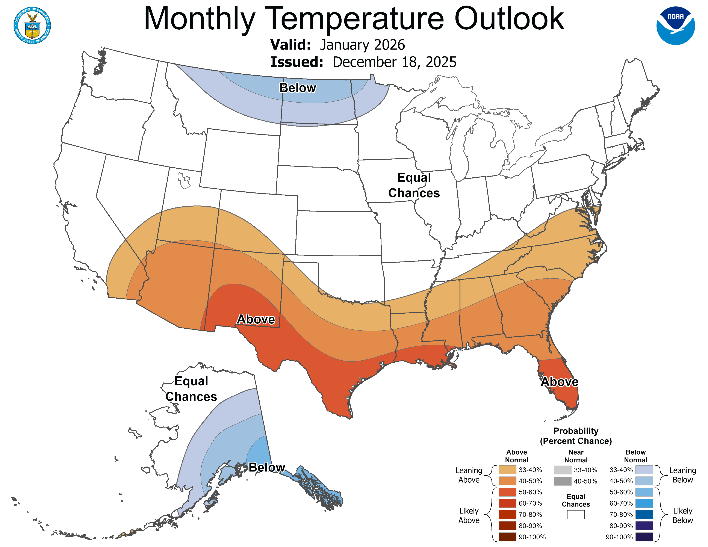
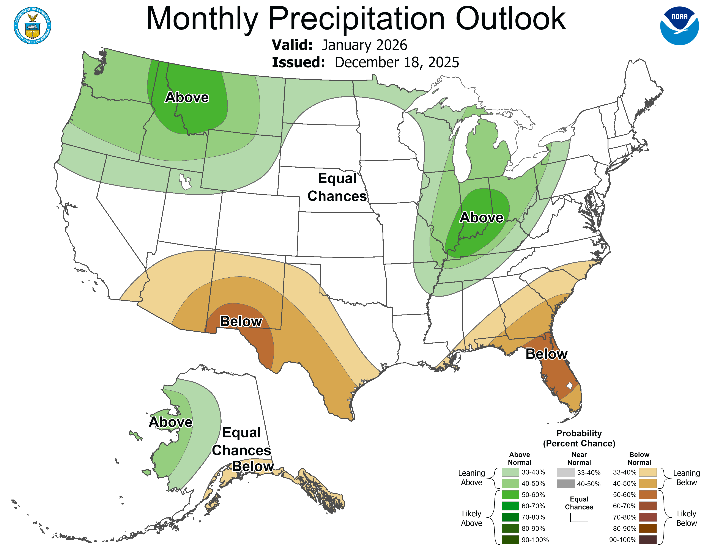
Fig. 2-3: NOAA/CPC U.S. temperature and precipitation probabilistic forecast valid January 2026.
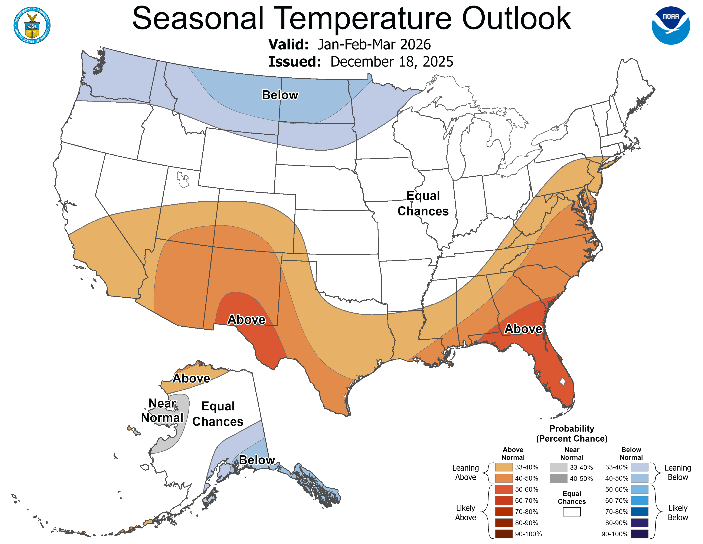
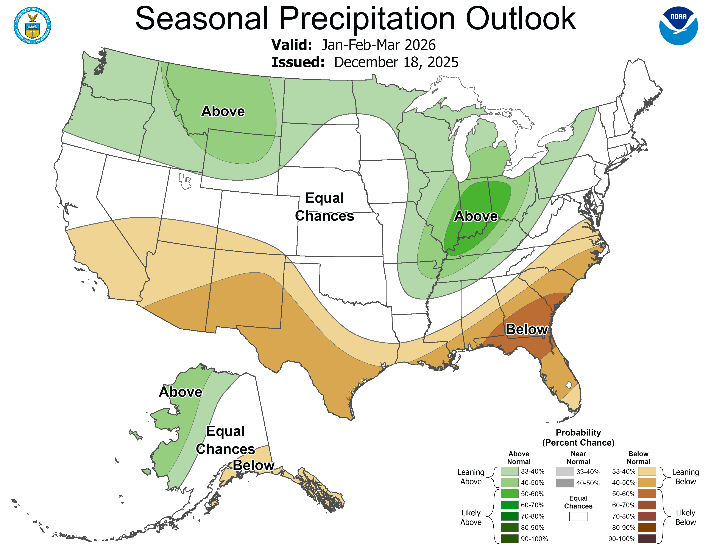
Fig. 4-5: NOAA/CPC U.S. temperature and precipitation probabilistic forecast valid January/February/March 2026.
Fig. 6-7: NOAA/CPC U.S. temperature and precipitation probabilistic forecast valid March/April/May 2026.
Fig. 8-9: NOAA/CPC U.S. temperature and precipitation probabilistic forecast valid June/July/August 2026.