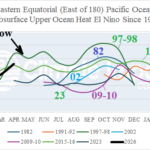
Upper Ocean Heat Rivals 1997-98 El Nino Now
05/01/2026, 8:46 am EDT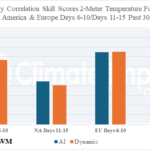
Comparing AI Vs. Dynamic Models 2-Meter Temperature Forecasts North America and Europe
05/07/2026, 4:33 am EDT
![]()
Climate Impact Company Sunday Global Weather/Climate Report
Issued: Sunday May 3, 2026
Highlight: Great Plains/East-central U.S. 15-day forecasts shift wetter, Western Europe wet pattern broadens, Brazil northern second corn crop zone stays dry, and a wetter change for Eastern Australia.
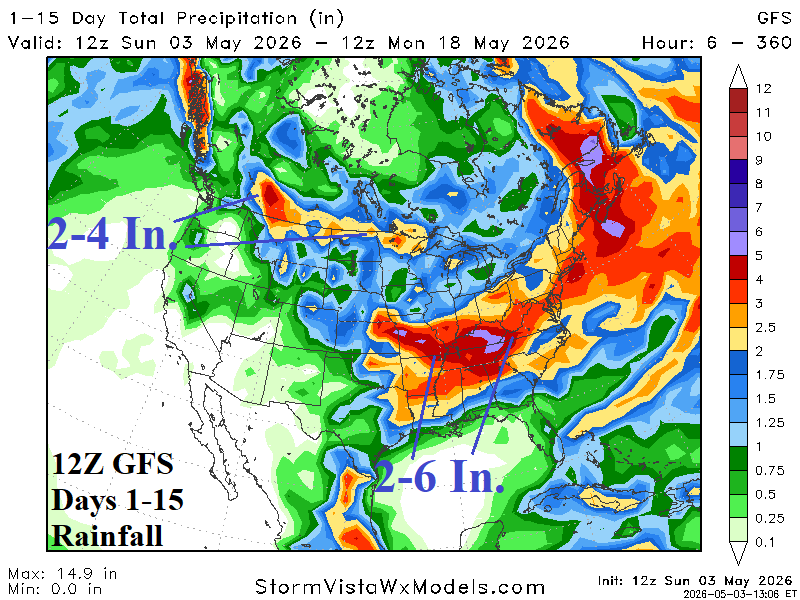
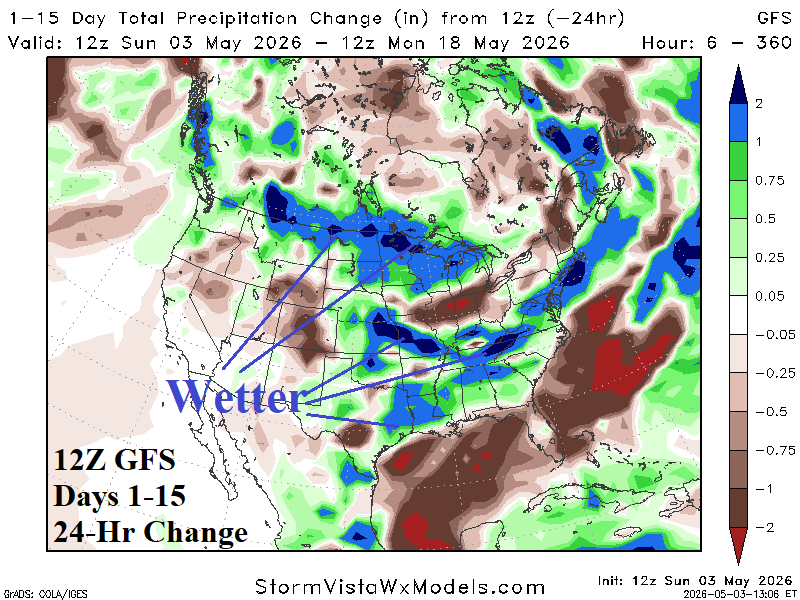
Fig. 1-2: 12Z GFS 15-day rainfall forecast and 24-hour change.
Discussion: At midday, the 12Z GFS produced a wetter forecast across the Great Plains and Midwest U.S. (Fig. 1). The forecast trend is wetter in the Mid-south States which have been wet and wetter for the North-central U.S. which has been dry (Fig. 2). Forecast bias has generally been too wet so far this spring in the Central U.S. Included in that bias are the extended range 16-30-day forecasts. Borth ECM and CFS V2 are too wet in the Great Plains and Southeast U.S. during the past 30 days although ECM is less wet in the Central U.S. (Fig. 3-4). Comparing ASI Graph Cast and ECM 16-30-day rainfall forecasts yields a wet regime centered on Texas with a dry bias across the northern half of the Great plains (Fig. 5-6).
Western Europe to Central Europe shifts wetter in weekend forecasts (Fig. 7). Patchy rains continue to affect the Black Sea region. The only drier change is across Western Russia. The northern half of the second corn crop region in Brazil is very dry in the latest 15-day forecast while parts of the southern second cord belt receive some thundershower activity (Fig. 8). Eastern Argentina is wet while west/northwest portions of Argentina are dry in the latest 15-day outlook.
Australia observed a very dry weather pattern during April (Fig. 9). However, the latest 15-day forecast shift is much wetter throughout eastern continent (Fig. 10).
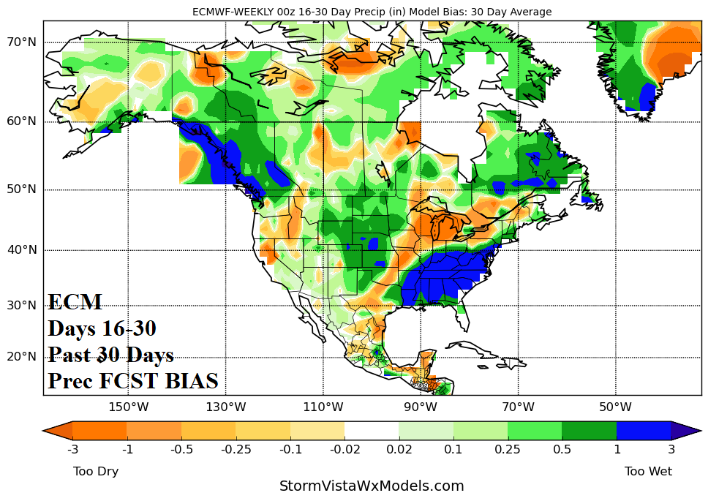
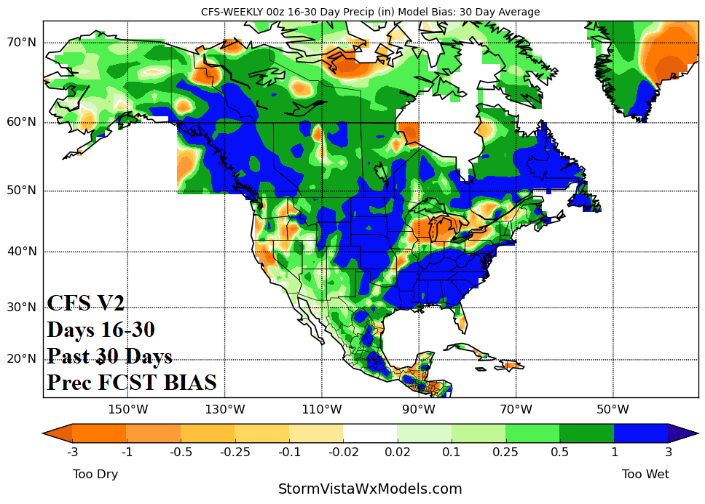
Fig. 3-4: ECM and CFS V2 16-30-day rainfall forecast bias from the past 30 days.
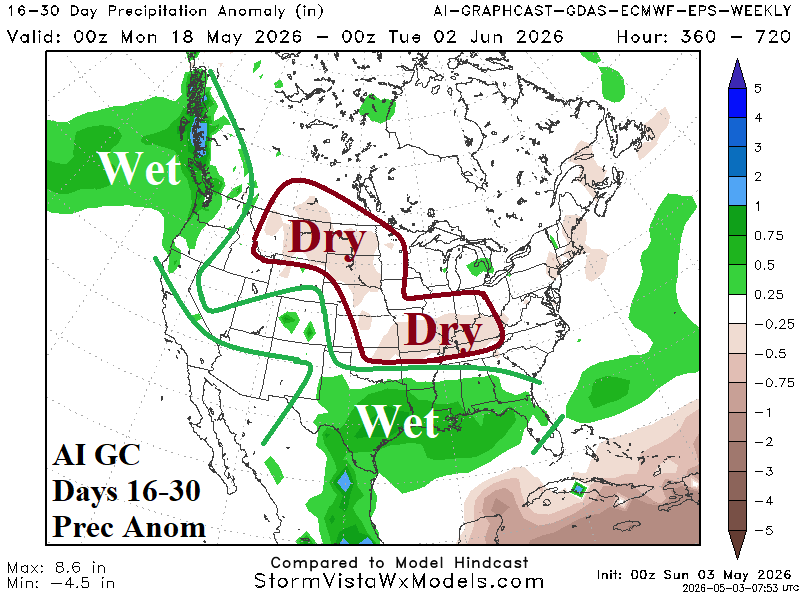
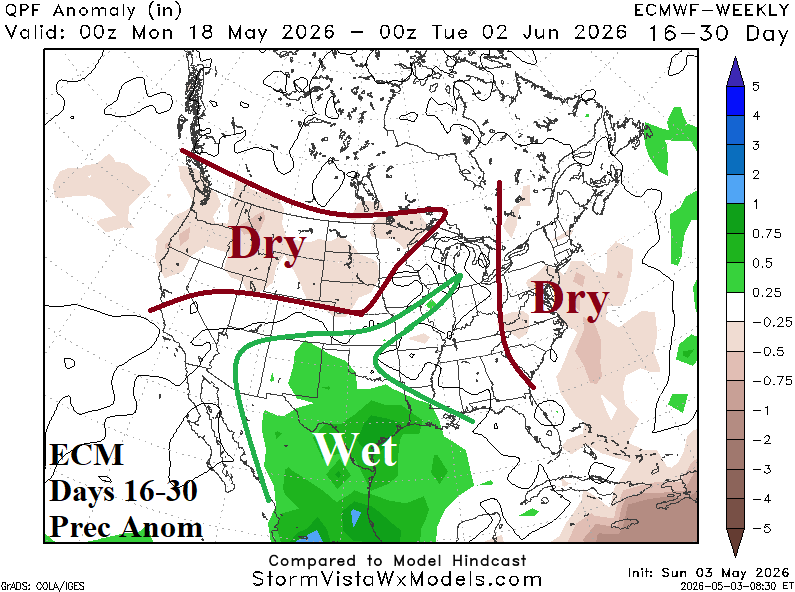
Fig. 5-6: AI Graph Cast and ECM 16-30-day rainfall anomaly forecast.
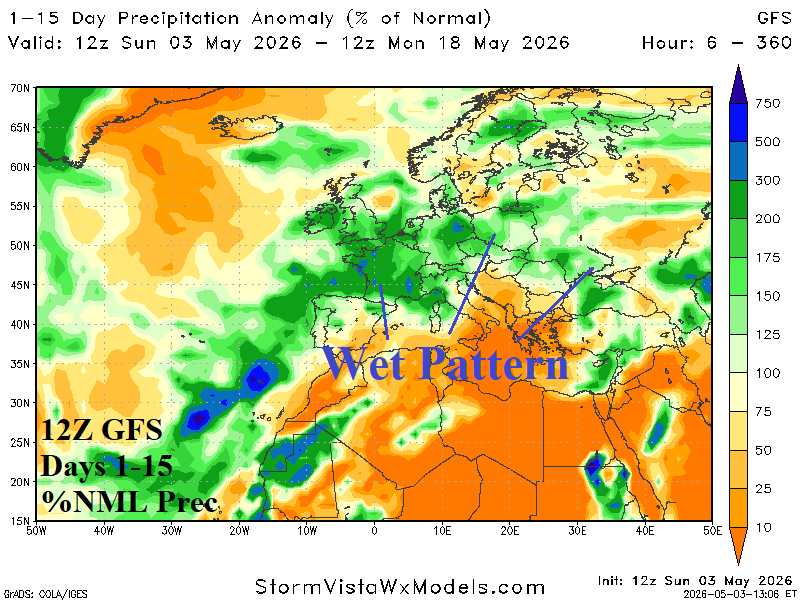
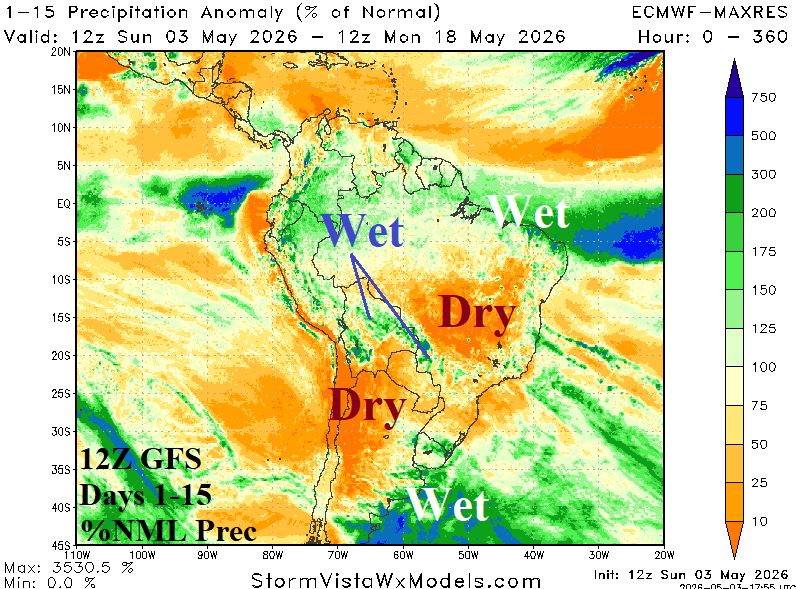
Fig. 7-8: The 12Z GFS Europe and South America percent normal 15-day rainfall forecast.
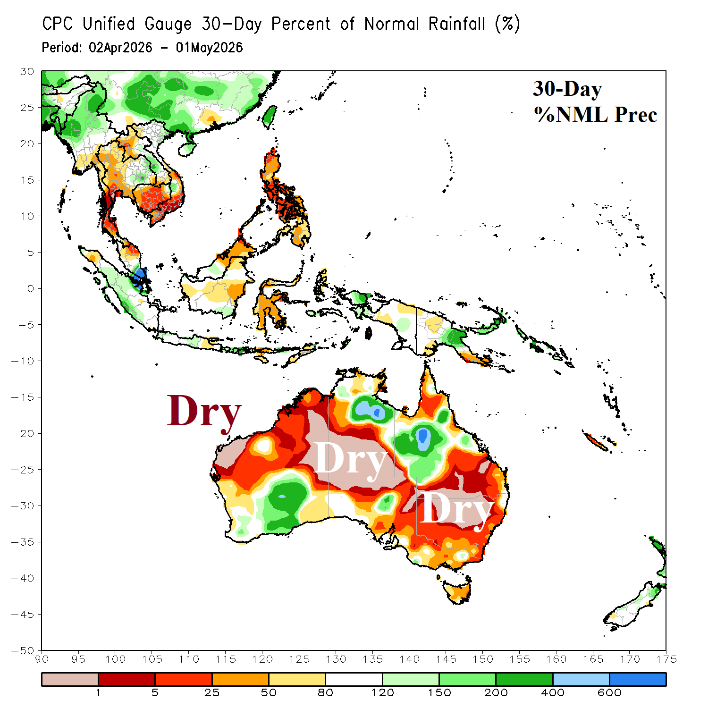
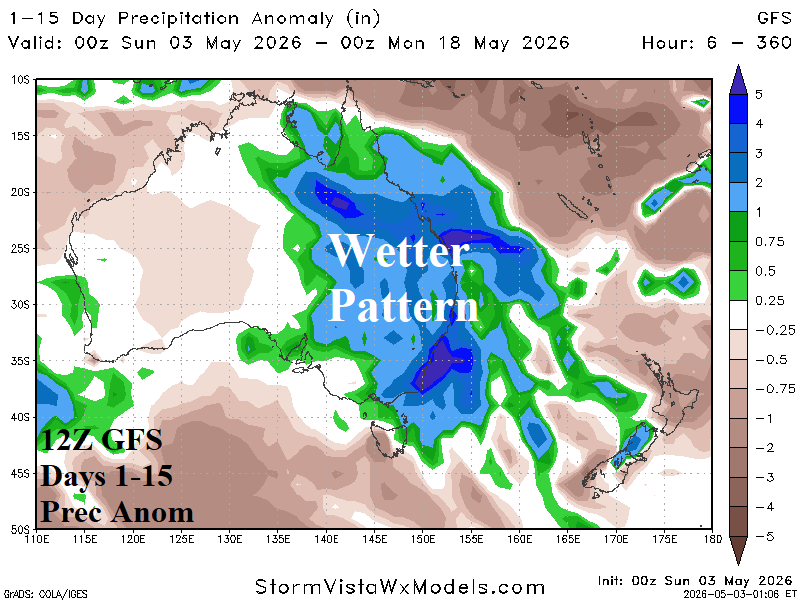
Fig. 9-10: 30-day percent normal rainfall observations across Indonesia and Australia plus the 12Z GFS percent normal rainfall forecast across Australia.