Brazil Heat and Dryness Accelerate Drought
09/29/2025, 4:43 am EDT
Evolving -NAO Pattern Could Cool East U.S. in Extended-range
10/05/2025, 1:27 pm EDT
Climate Impact Company Early AG Market ALERT
Issued: Wednesday October 1, 2025
Highlight: Is Brazil rain ahead later this month? U.S. AG Belt trend is wetter in the 8-14-day period.
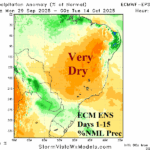
Discussion: Drier than normal weather is in the 10-day forecast across much of Brazil and Argentina (Fig. 1). The Brazil dryness is accompanied by significant anomalous heat. Consequently, the Brazil drought worsens rapidly. In the 11-15-day period, forecast models are introducing some rain. However, the best consensus forecast is ECM ENS which is still (mostly) dry across the Brazil area (Fig. 2). Climate forecasts indicate wetter weather ahead for the Brazil drought area in Q4/2025. The ECM week 3-4 forecast projects a wet anomaly across the drought area (Fig. 3). The latest Madden Julian oscillation (MJO) forecast indicates an emerging moderate-strength phase_8 (Fig. 4) which supports a wetter climate shift for South America, specifically Brazil, by week-3.
In the U.S., dryness prevails across the U.S. AG Belt for most of the next 7 days (Fig. 5). However, forecast models are agreeable on a wetter trend centered on the Midwest States in the 8-14-day period (Fig. 6). Despite the rain, NOAA expands the drought in the Midwest plus farther southward in October (Fig. 7).
Charts of the Day
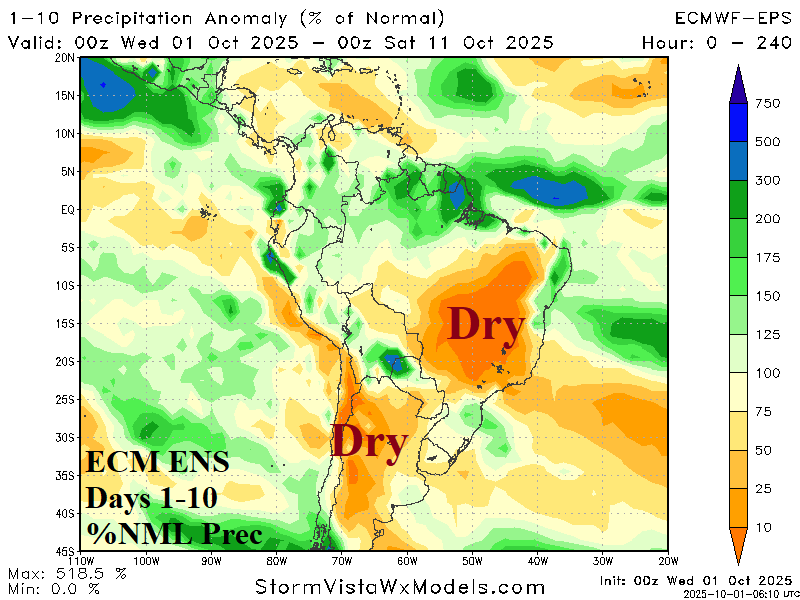

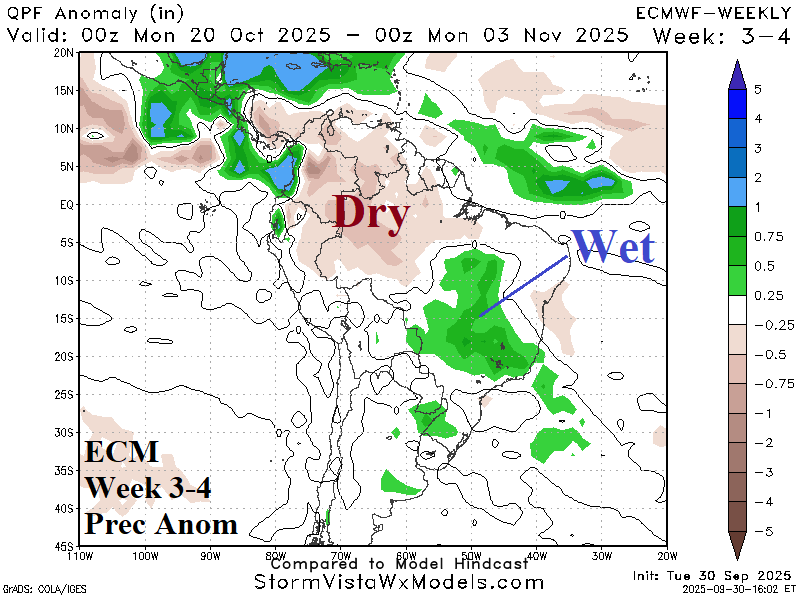
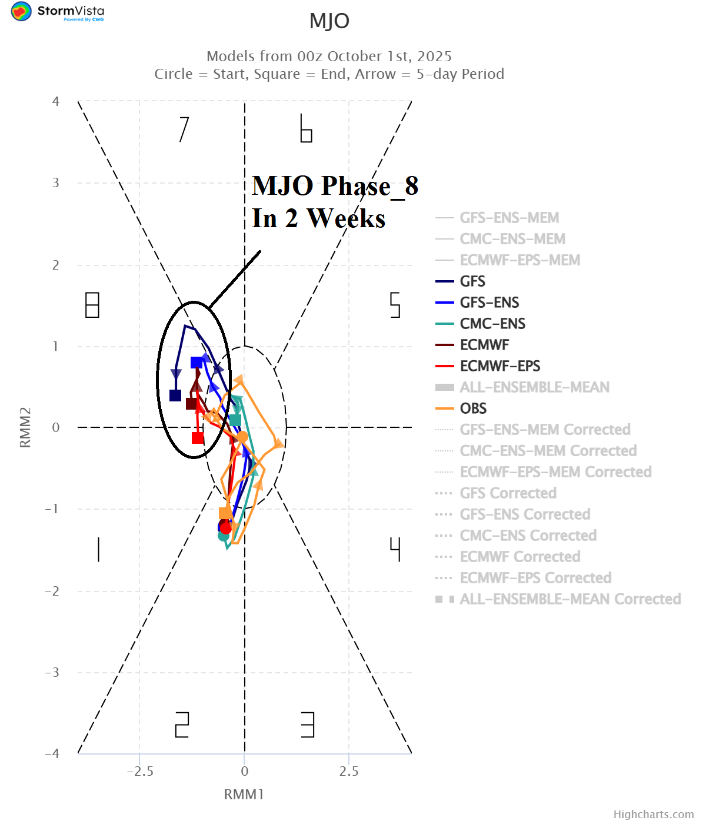
Fig. 1-4: The ECM ENS 10-day and 11-15-day percent of normal rainfall forecast across South America plus the 3-4-week rainfall anomaly outlook from ECMWF. The 15-day MJO forecast is also indicated.
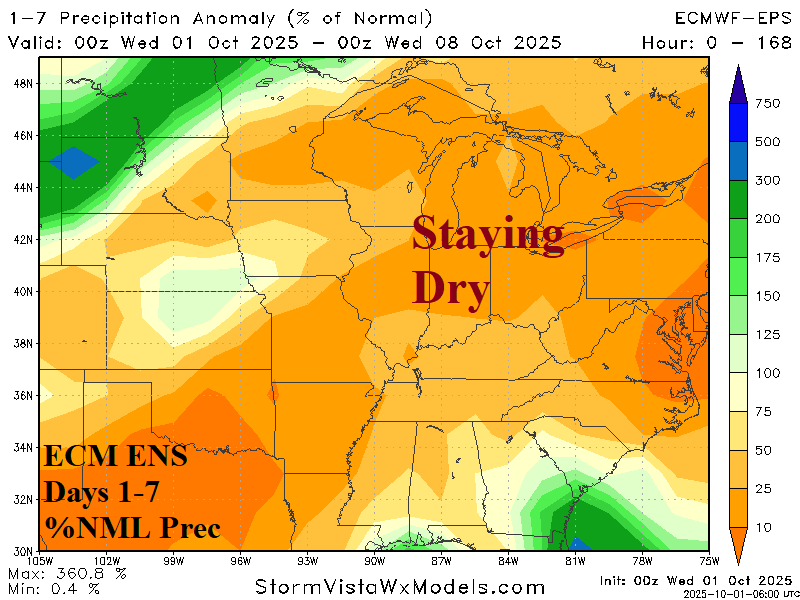
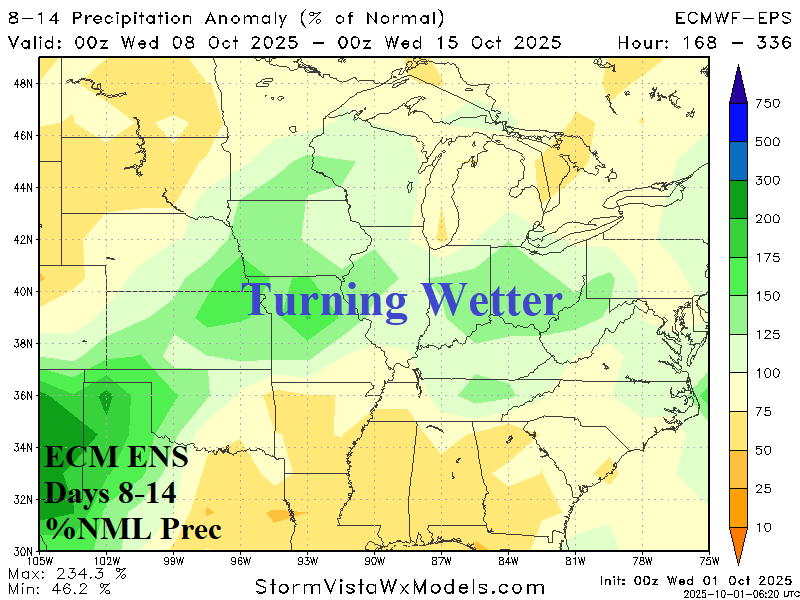
Fig. 5-6: The ECM ENS 1-7-day and 8-14-day percent of normal rainfall forecast across the U.S. AG Belt.
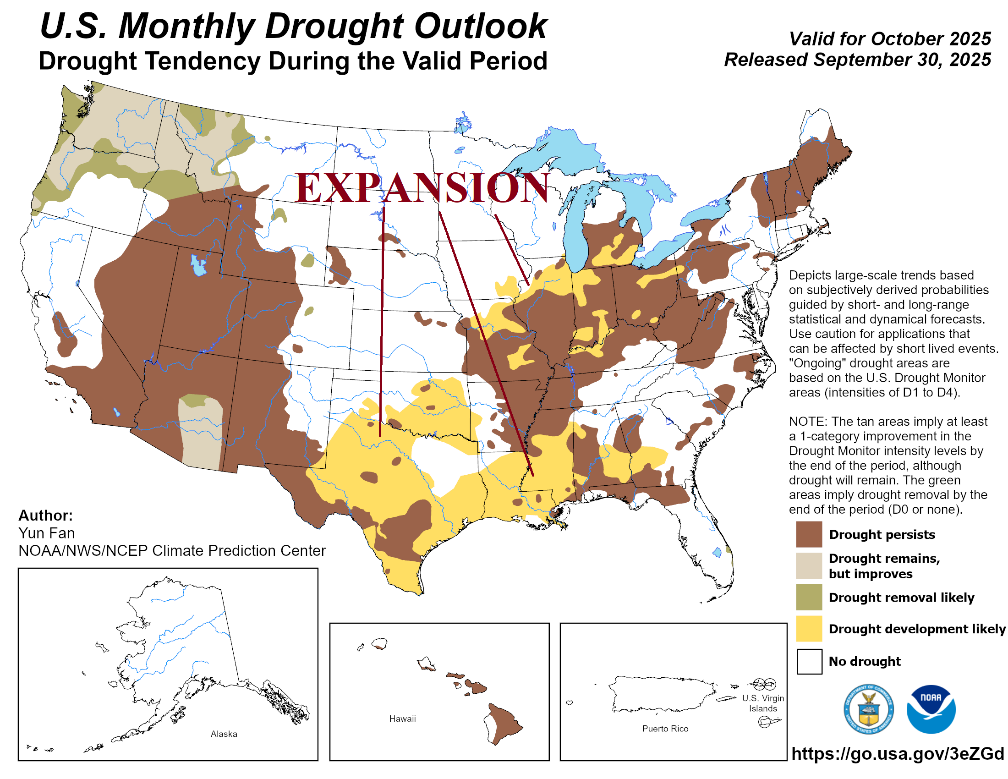
Fig. 7: The NOAA monthly drought outlook valid for October.